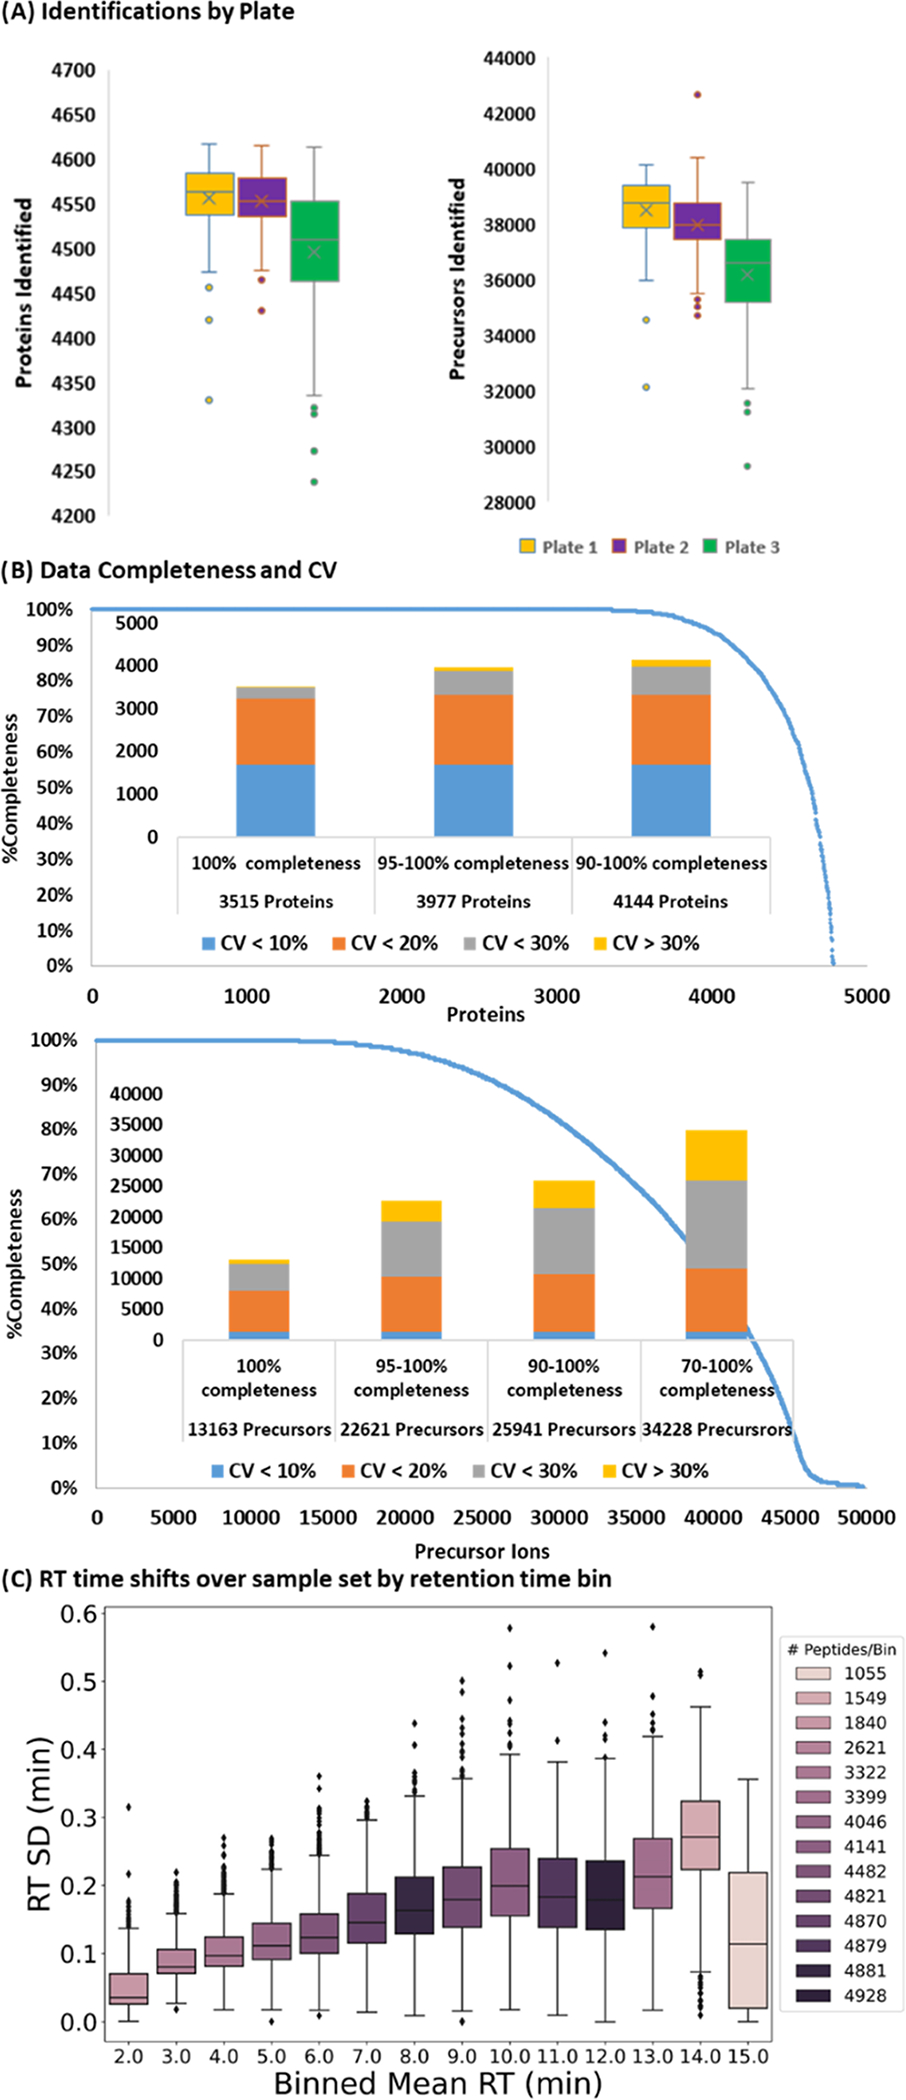
Figure 5.

Cell lysate analysis (A) protein (left) and precursor ion (right) identification distribution on each plate. (B) Data completeness curve for proteins (top) and precursor ions (bottom) over all samples. The bar graphs represent the %CV distributions at different completeness levels: blue < 10 %; orange 10–20%; gray 20–30%; and yellow > 30%. (C) Standard deviation of peptide RT binned by average retention time.
