Figure.
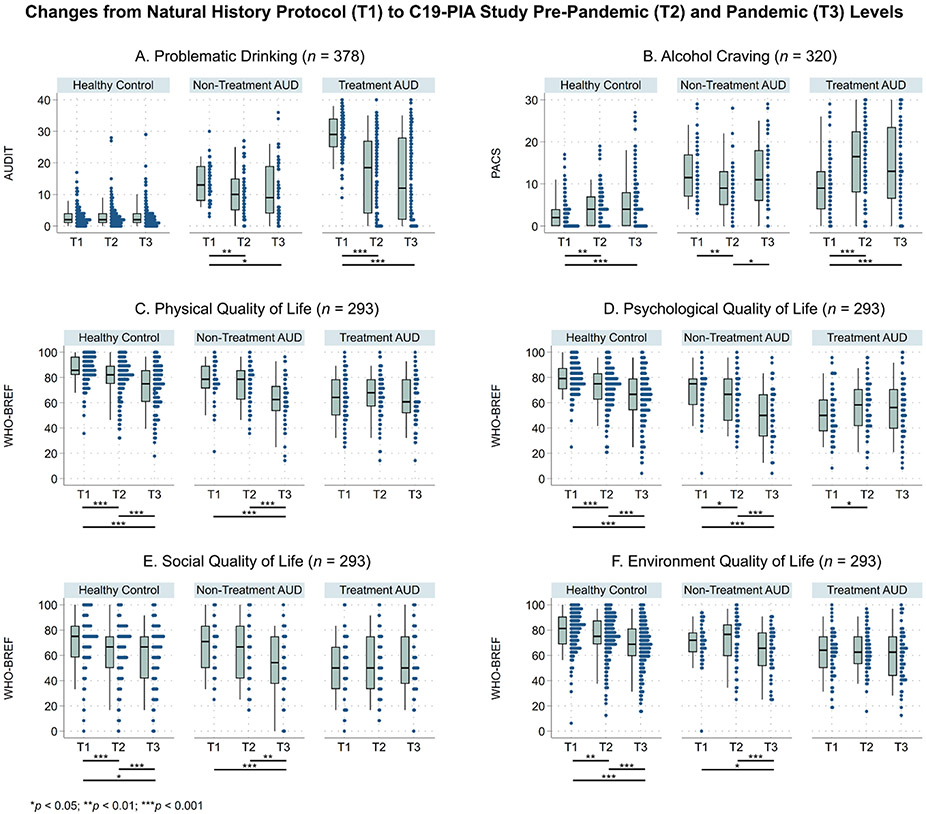
Changes in problematic drinking, alcohol craving, and quality of life domains by AUD-treatment groups
The box plots show the 5th, 25th, 50th, 75th, and 95th percentiles of study outcomes, and the distributions of data points are plotted to the right of the box plots. More heterogeneous responses were observed at T2 and T3 than at T1. Missing data in PACS (n = 58) reflected a skip logic for individuals who abstained from alcohol at T3. Missing data in quality of Life (QoL) were found in 85 participants. Missingness in QoL did not differ by age, sex, race, cohort, or enrollment phase, and were handled using complete case analyses.
Abbreviations: AUD = alcohol use disorder, AUDIT = Alcohol Use Disorders Identification Test, PACS = Penn Alcohol Craving Scale, WHOQOL-BREF = World Health Organization QoL-BREF. T1, Natural History Protocol; T2, C19-PIA Study Retrospective Report of Pre-Pandemic Levels; T3, C19-PIA Study During Pandemic.

