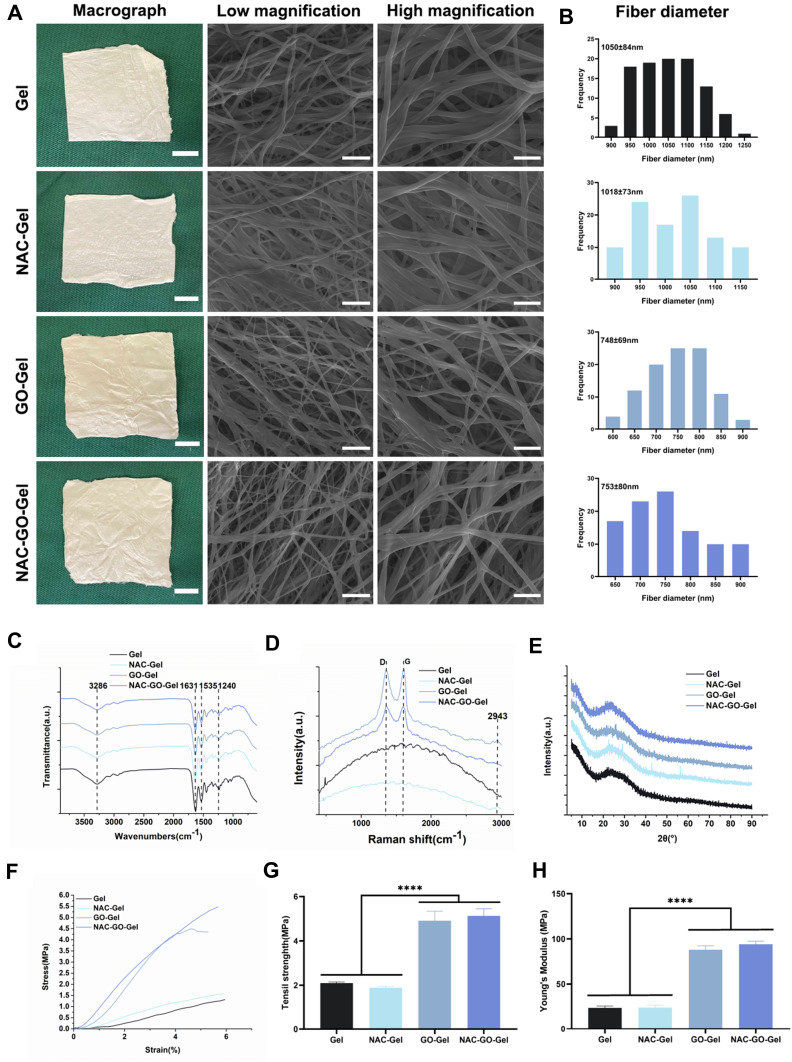
Figure 2.
Characterization of NAC-GO-Gel nanofibrous scaffolds. (A) Macrographs and FESEM images (scale bar: low magnification=10 μm, high magnification=5 μm); (B) histograms of nanofibers’ diameter distribution; (C) FTIR spectroscopy; (D) Raman spectroscopy; (E) XRD spectroscopy; (F) tensile stress–strain curves; (G) tensile strength, and (H) Young’s modulus of the scaffolds (mean±SD, ****P <0.0001).

