Figure 7.
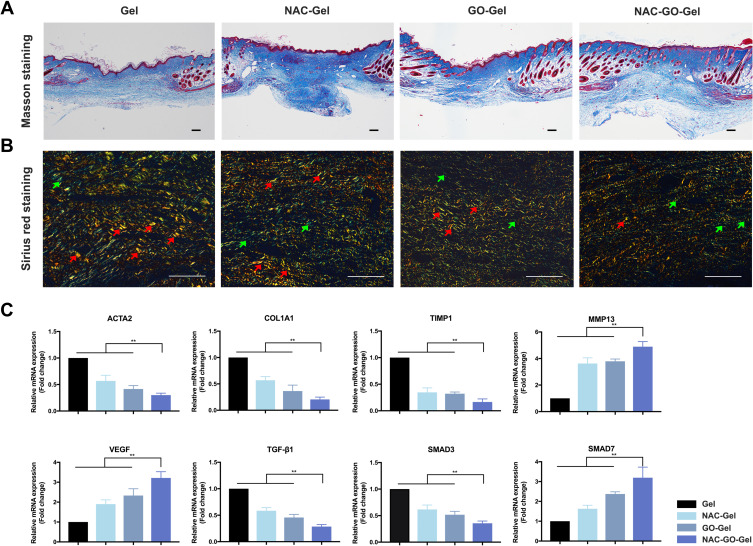
Collagen deposition and fibrotic genes expression of wound tissues on day 14. (A) Masson’s Trichrome staining and (B) Sirius red staining of tissue sections (scale bars=100 µm), The red arrows and green arrows indicate the type I collagen and type III collagen, respectively. The NAC-GO-Gel group shows a remarkably decreased ratio of type I/III collagen which indicated a reduction of scar formation; (C) relative mRNA expressions of fibrosis-related genes 14 days post-wounding (mean ± SD, **P < 0.01).

