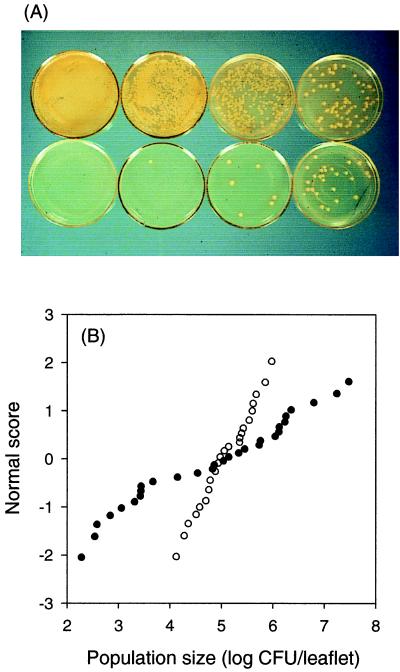
FIG. 6.
Quantitative variability in population sizes of P. syringae on individual leaves. (A) Each plate represents an equivalent dilution from washings of different individual rye leaves. (B) Lognormal distribution of population sizes of P. syringae on two sets of individual bean leaflets. The mean population size for both sets of leaflets is approximately 5.0 log CFU/leaflet. The population variances are 2.5 for set A (●) and 0.23 for set B (○). Reprinted from reference 111 with the permission of the publisher.

