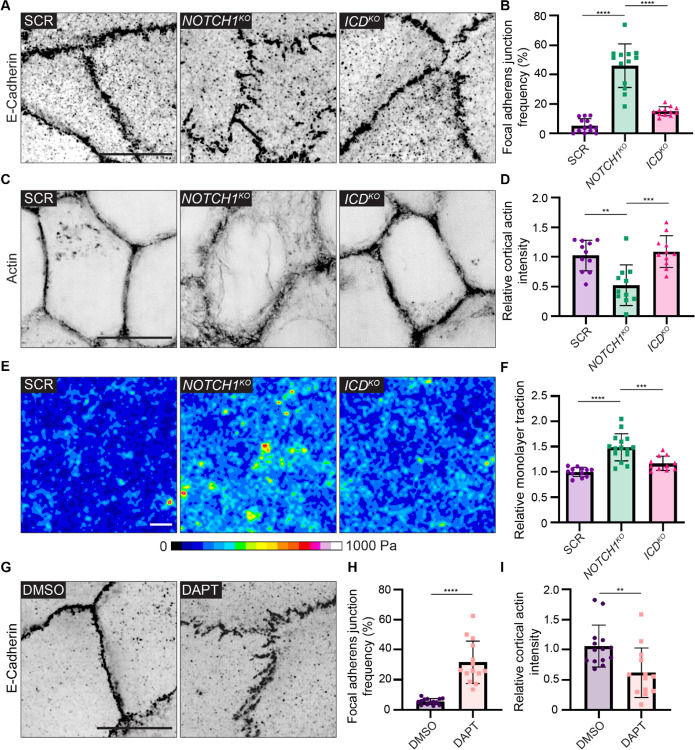
Figure 3. Notch1 cortical signaling stabilizes adherens junctions and cortical actin organization.
(A) Super resolution by optical pixel reassignment (SoRa) fluorescence micrographs SCR, NOTCH1KO, and ICDKO monolayers immunostained for E-Cadherin (black). Scale bar, 10 μm. (B) Quantification of the frequency of focal adherens junctions. n ≥ 12 fields of view from three independent experiments. (C) SoRa fluorescence micrographs of SCR, NOTCH1KO, and ICDKO monolayers labeled with phalloidin (black). Scale bar, 10 μm. (D) Intensity of cortical actin at cell–cell junctions, quantified from phalloidin-stained micrographs. n ≥ 12 fields of view from three independent experiments. (E) Traction force microscopy traction maps averaged from ten fields of view from SCR, NOTCH1KO, and ICDKO monolayers. Scale bar, 20 μm. (F) Quantification of relative integrated monolayer tractions. n ≥ 11 traction force measurements from three independent experiments. (G) Fluorescence micrographs of wild-type cells treated with DMSO or 10 μM DAPT for two hours and immunostained with E-Cadherin (black). Scale bar, 10 μm. (H) Quantification of the frequency of focal adherens junctions in DMSO and DAPT treated cells. n ≥ 13 fields of view from three independent experiments. (I) Intensity of cortical actin at cell–cell junctions, quantified from phalloidin-stained micrographs of DMSO and DAPT treated cells. n ≥ 13 fields of view from three independent experiments. For plots B, D, and F, mean ± SEM; one-way ANOVA with Tukey’s post-hoc test, **p<0.01, ***p<0.001, ****p<0.0001. For plots H and I, mean ± SEM; two-tailed unpaired t test, **p<0.01, ****p<0.0001.

