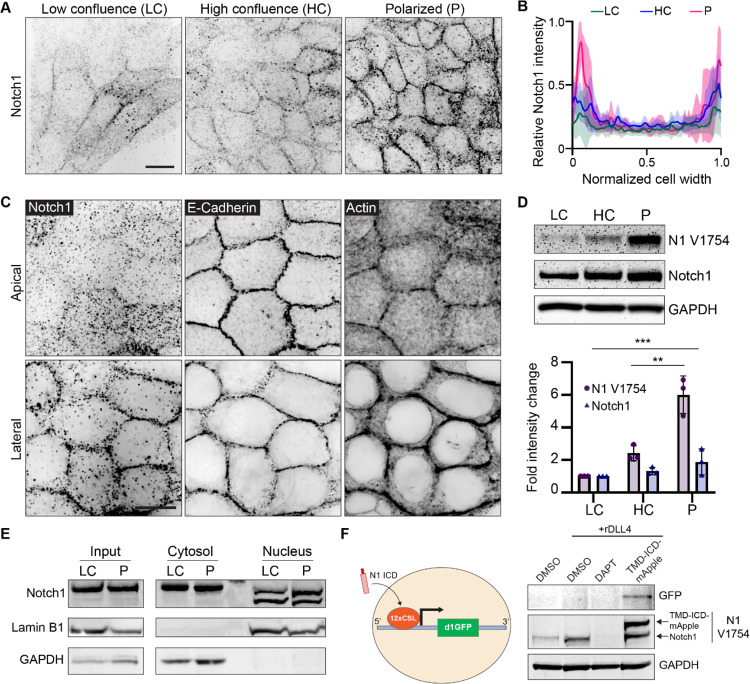
Figure 4. Localization and proteolytic activation of Notch1 at lateral cell-cell contacts.
(A) Immunofluorescence micrographs of Notch1 (black) in wild type MCF10A in low confluence (LC), high confluence (HC), and polarized (P) states. Scale bar, 20 μm. (B) Quantification of relative Notch1 intensity across the width of the cell. n = 8 cells from three independent experiments. (C) Representative SoRa immunofluorescence micrographs of wild type monolayers immunostained for E-Cadherin and Notch1 and labeled with phalloidin. Top row: apical domain. Bottom row: lateral domain. Scale bar, 20 μm. (D) Top: Western blot of wild type lysates from the indicated monolayer states, immunoblotted for cleaved Notch1 V1754 (N1 V1754), total Notch1, and GAPDH. Bottom: Quantification of fold change in N1 V1754 and total Notch1 band intensities. n = 3 independent experiments. (E) Western blot of cytosolic and nuclear fractions from wild type monolayer lysates in low confluence (LC) and polarized (P) states, immunoblotted for total Notch1, Lamin B1, and GAPDH (F) Left: Schematic of Notch1 transcriptional destabilized GFP reporter (d1GFP). Right: Western blot of lysates from wild type monolayers treated with DMSO, DMSO + rDLL4, DAPT + rDLL4, or overexpressing constitutively active form of Notch1 (TMD-ICD-mApple), immunoblotted for GFP, N1 V1754, and GAPDH. Western blots are representative of three independent experiments. For plot in D, mean ± SEM; one-way ANOVA with Tukey’s post-hoc test, **p<0.01, ***p<0.001.

