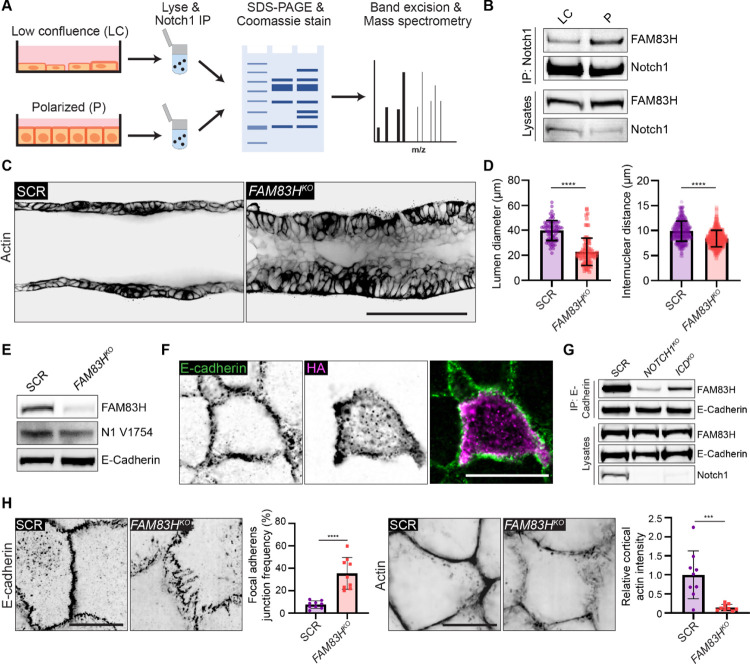
Figure 5. Notch1 cortical signaling functions through FAM83H to stabilize adherens junctions and control duct architecture.
(A) Schematic of mass spectrometry workflow to identify monolayer state-dependent, differential Notch1 protein-protein interactions. (B) Western blot of immunoprecipitated Notch1 from low confluence (LC) or polarized (P) monolayers immunoblotted for FAM83H and Notch1. (C) Representative medial confocal slice fluorescence micrographs of SCR and FAM83HKO ducts labeled with phalloidin (black). Scale bar, 100 μm. (D) Left: Quantification of duct lumen diameter. n ≥ 9 average lumen diameters from three independent experiments. Right: Quantification of internuclear distances measured from Hoechst labeled ducts. n ≥ 50 internuclear distances per duct from three independent experiments. (E) Western blot of lysates from SCR or FAM83HKO monolayers immunoblotted for FAM83H, cleaved Notch1 V1754 (N1 V1754), and E-Cadherin. (F) Immunofluorescence micrographs of HA-FAM83H expressing cell immunostained for E-Cadherin (green) and HA (magenta). Scale bar, 20 μm. (G) Western blot of immunoprecipitation of E-Cadherin from SCR, NOTCH1KO, and ICDKO monolayer immunoblotted for FAM83H and E-Cadherin. (H) Left: Immunofluorescence micrographs of SCR and FAM83HKO cells immunostained with E-Cadherin (black) and the corresponding quantification of the frequency of focal adherens junctions. Scale bar, 10 μm. n ≥ 9 fields of view from three independent experiments. Right: Fluorescence micrographs of SCR and FAM83HKO monolayers labeled with phalloidin (black) and the corresponding quantification of cell-cell junction cortical actin intensity. Scale bar, 10 μm. n ≥ 9 fields of view from three independent experiments. Western blots are representative of three independent experiments. For all plots, mean ± SEM; two-tailed unpaired t test, ***p<0.001, ****p<0.0001.

