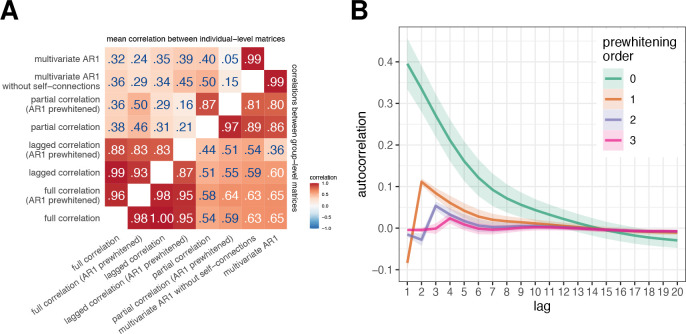
Figure 2: Correlations between FC estimates obtained using different FC methods.
A. We calculated the similarities between FC estimates obtained using different FC methods (i) by averaging connectivity matrices across participants and then computing correlations between them (correlation between group-level FC, bottom right triangle), and (ii) by computing correlations between the FC estimates for each participant separately and then averaging across participants (correlation between individual-level FC, top left triangle). B. Autocorrelation function of experimental data as a function of prewhitening order. The mean autocorrelation function was computed over all participants and regions; the ribbons represent the standard deviation.

