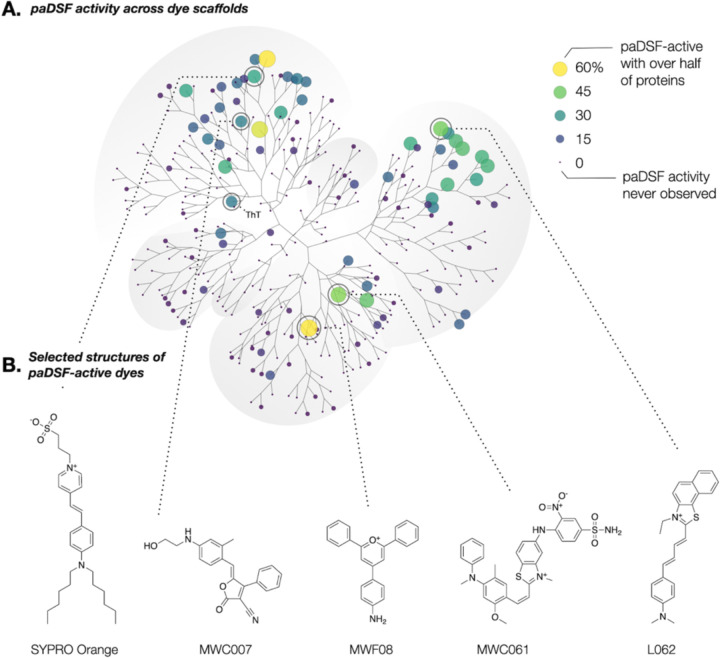
Fig. 4. Emergence of structural trends within paDSF dyes.
(A) Annotated polar dendrogram of structural relationships between the 312 dyes in Aurora, as determined by pairwise ECFP4 Tanimoto coefficient followed by hierarchical clustering. Each point (“node”) represents a single dye. Point size and point color represent the percentage of the 70 tested proteins (60 protein panel + 10 proteins from SARS-CoV2) for which that dye was a paDSF hit. Larger, lighter points indicate a more general dye; smaller, darker points indicate more selective dyes. (B) Chemical structures of selected high-performing paDSF dyes from Aurora.

