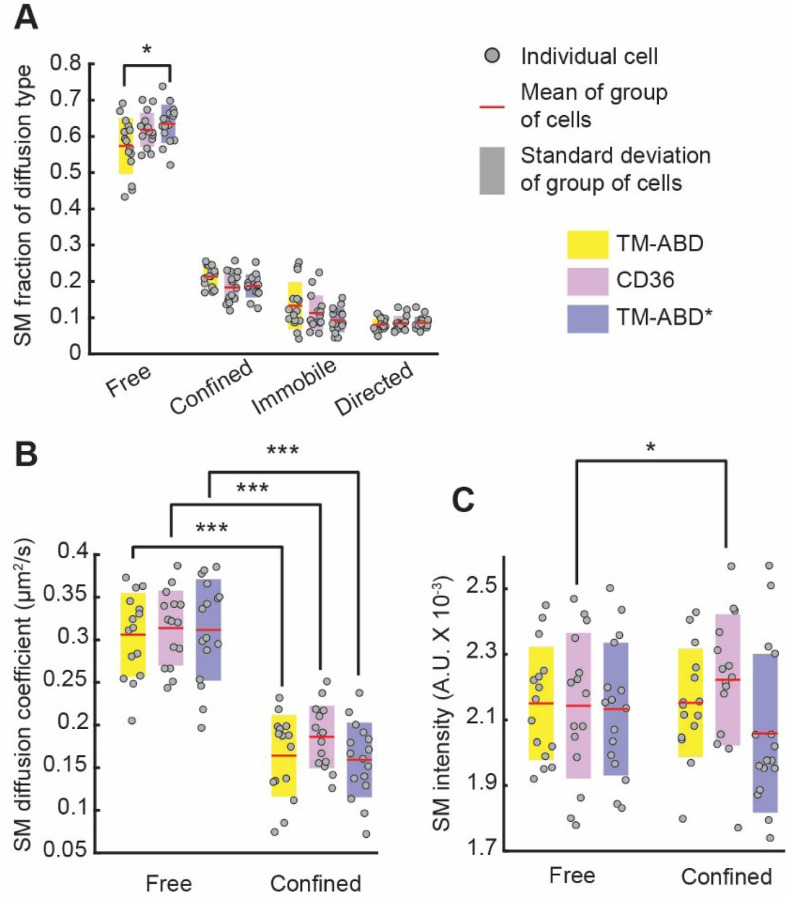
Figure 2. Dynamic organization of PM proteins reflects their actin binding abilities.
(A) Fraction, (B) diffusion coefficient and (C) intensities of SM tracklets of CD36 (magenta), TM-ABD (yellow) and TM-ABD* (blue) undergoing the indicated diffusion types. Gray circles show individual cell measurements (fraction in A and average in B and C). Red lines and shaded bars show mean and standard deviation, respectively, over group of cells representing a particular PM protein. Different PM proteins were compared using ANOVA followed by Tukey-Kramer post-hoc analysis; free and confined properties for the same PM protein were compared using paired t-tests. *, ***: p-value ≤ 0.05, 0.001, respectively. p-values > 0.05 are not explicitly indicated. See Table S8 for sample size and other dataset details.

