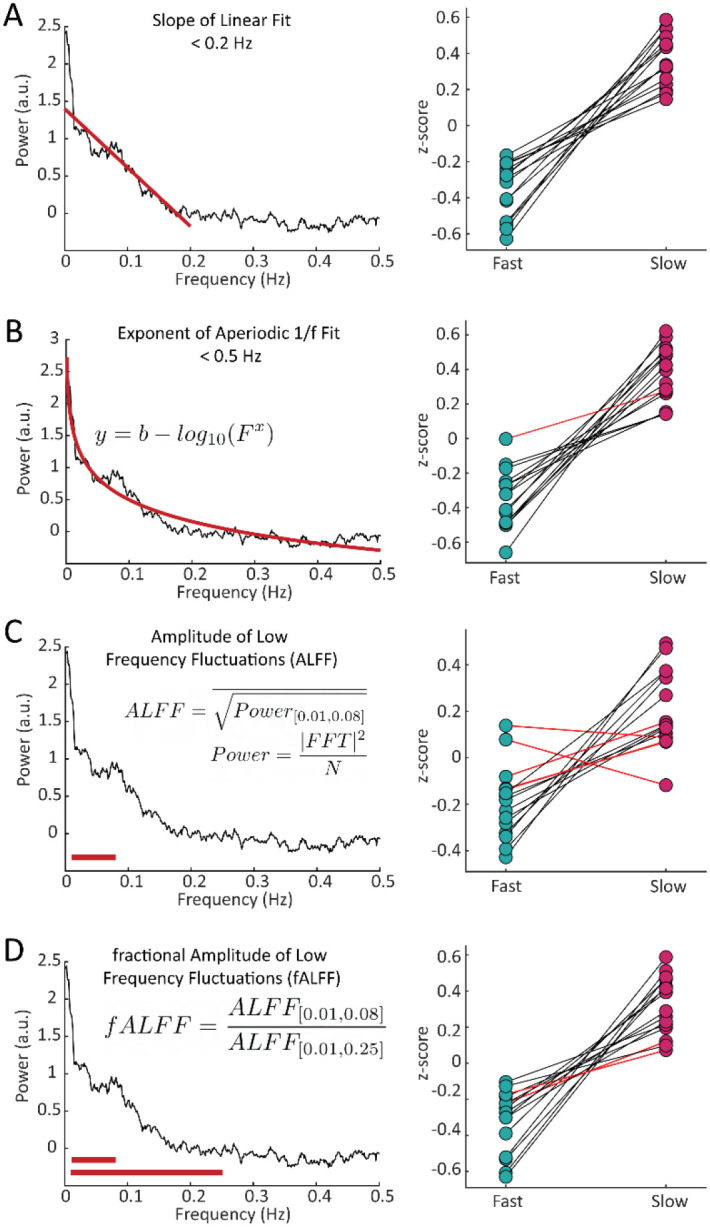
Figure 3– Features of the resting-state spectrum differed between fast and slow voxels in each subject.

For each subject, we calculated four features of the resting-state frequency spectrum and compared the values between the task-defined fast and slow voxels using a Wilcoxon rank sum test. For the A) slope, using a linear fit of frequency spectrum under 0.2 Hz, 15/15 subjects showed significant differences; B) exponent of an aperiodic 1/f fit under 0.5 Hz, 14/15 subjects showed significant differences; C) amplitude of low frequency fluctuations (ALFF), 11/15 subjects showed significant differences; and D) fractional ALFF, 13/15 subjects showed significant differences. Black lines indicate a significant difference in a given subject (Wilcoxon rank-sum test, p < 0.05) and red lines indicate a non-significant difference.
