
Figure 6 – Average classification accuracy of SVM classifier trained using different features.
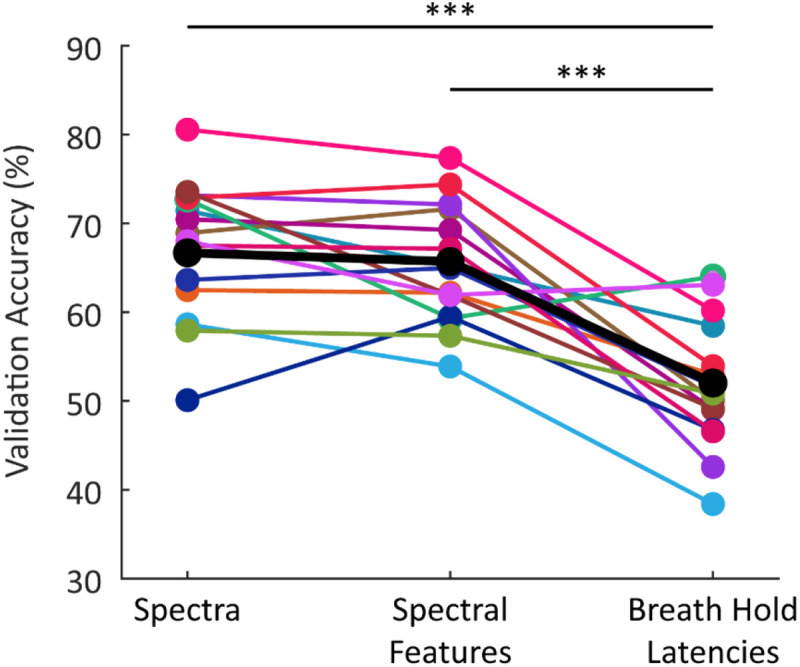
The classification accuracies reported are the average validation accuracy across 1000 bootstraps. The black markers indicate the models trained using resting-state spectral features from all subjects combined into one model; the colored markers show results from individual subjects (n=15). Both models trained using features of the resting-state spectrum performed significantly better than the model trained using the breath hold latencies; however, there was no significant difference in performance between the two models trained using information from the resting-state spectrum (p=0.283). All classifiers perform significantly above chance (33%). *** p<0.0005 (Wilcoxon signed-rank test).