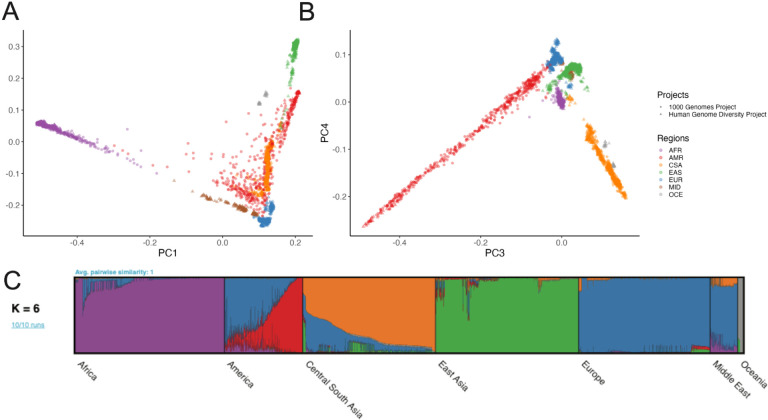
Figure 2 |. Global ancestry analysis of genetic structure in the HGDP and 1kGP resource.
Regional abbreviations are as in Figure 1. A-B) Principal components analysis (PCA) plots for A) PC1 versus PC2 and B) PC3 versus PC4 showing global ancestry structure across HGDP+1kGP. Subsequent PCs separated structure within geographical/genetic regions (Figure S9-S16). C) ADMIXTURE analysis at the best fit value of K=6.

