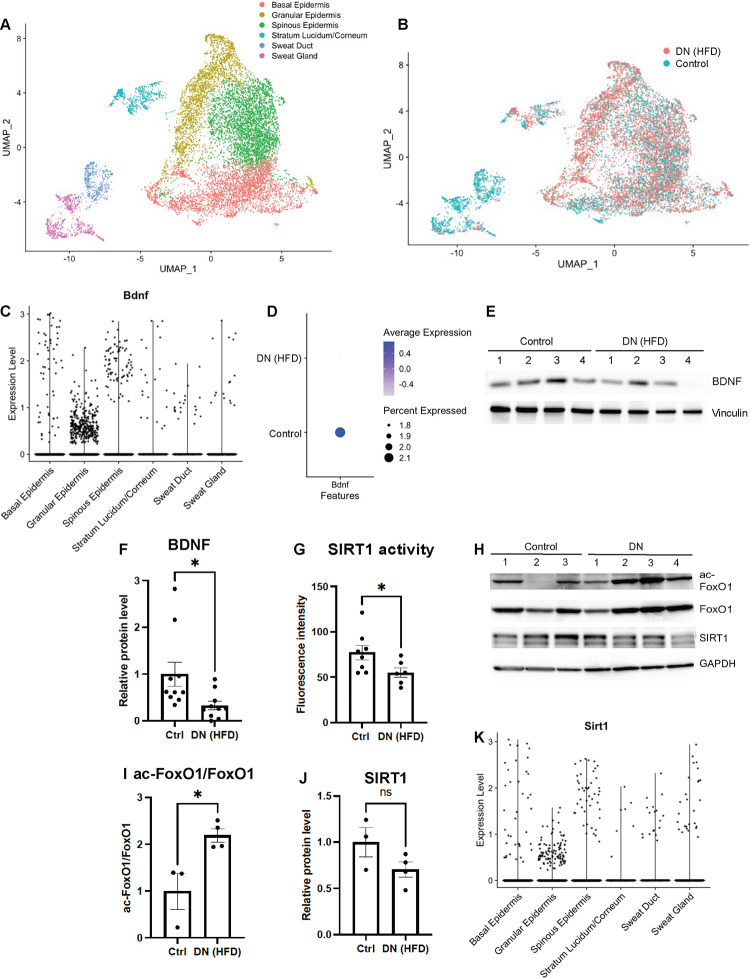
Fig. 2. Decreased expression of BDNF in foot skin of mice with diabetic neuropathy.
(A) UMAP projection of single-cell RNA-seq (scRNA-seq) data from mouse foot pad skin epithelial cells colored by cell subtype annotation (n = 11,079). (B) UMAP plot of foot pad skin epithelial cells from mice with diabetic neuropathy (DN) (HFD for 4 months) and control mice (n = 4 for each group). (C) Violin plot demonstrating BDNF expression levels in different subtypes of epithelial cells in mouse foot pad skin. (D) Dot plot indicating the differential BDNF expression in epidermal keratinocytes between the control and DN mice. The size of the circles represents the percentage of BDNF-expressing cells, and the color of the circles represents the level of BDNF expression. Note that there is no BDNF expression (circle) in the intra-pad epidermis. (E) A representative Western blot of mouse foot skin lysates with antibodies against BDNF and vinculin, a loading control. (F) Comparison of normalized mature BDNF protein level in foot skin of control and DN mice (n = 9 for each group). (G) Measurement of SIRT1 deacetylase activity in mouse foot skin by fluorometric assay (n = 8 for the control; n = 6 for DN). (H) Western blot probing for the acetylated form of the SIRT1 substrate FoxO1. Also shown are blots for total FoxO1, SIRT1 and GAPDH (loading control), respectively. (I) Comparison of acetyl-FoxO1/FoxO1 protein ratio and (J) normalized SIRT1 protein level in foot skin of control (n = 3) and DN mice (n = 4). (J) Violin plot demonstrating SIRT1 expression levels in different subtypes of epithelial cells in mouse foot pad skin. Error bars indicate SEM. Statistics were performed by Student’s t-test: * p < 0.05, ns = non-significant.

