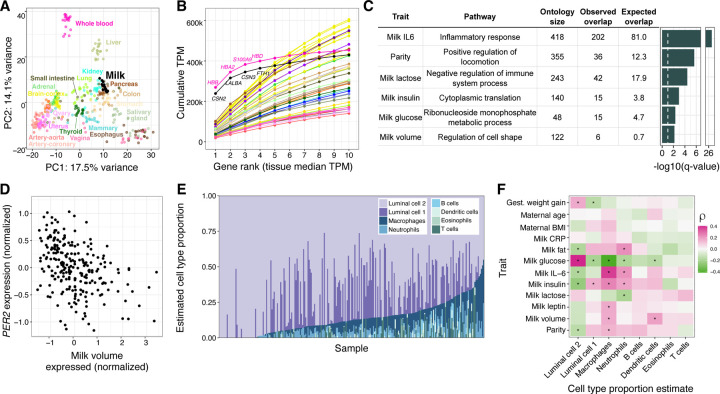
Figure 1. Overview of gene expression in human milk.
A) Principal components analysis of transcriptomes from a subset of GTEx tissues and milk. PCs were calculated using the 1000 most variable genes within GTEx, then milk samples were projected onto the GTEx samples. An equivalent plot including all GTEx tissues is in Fig. S1. B) Cumulative TPM (transcripts per million) of the top 10 genes by median TPM for milk and GTEx tissues. Color scheme is the same as in 1A. C) Gene ontology enrichment of genes with expression correlated to maternal and milk traits. The most significant term for each trait is shown (Methods). The dashed white vertical line denotes a q-value of 10%. D) Correlation between milk volume (from a standardized electric breast pump expression during a study visit, see Methods) and normalized PER2 gene expression in milk. E) Cell type proportion estimates generated using Bisque30 for transcriptomes from this study, and reference milk single cell RNA-seq from Nyquist et al 202217. F) Heatmap of Spearman correlations between estimated cell type proportions (x-axis) and maternal/milk traits (y-axis). *q-value<10%.

