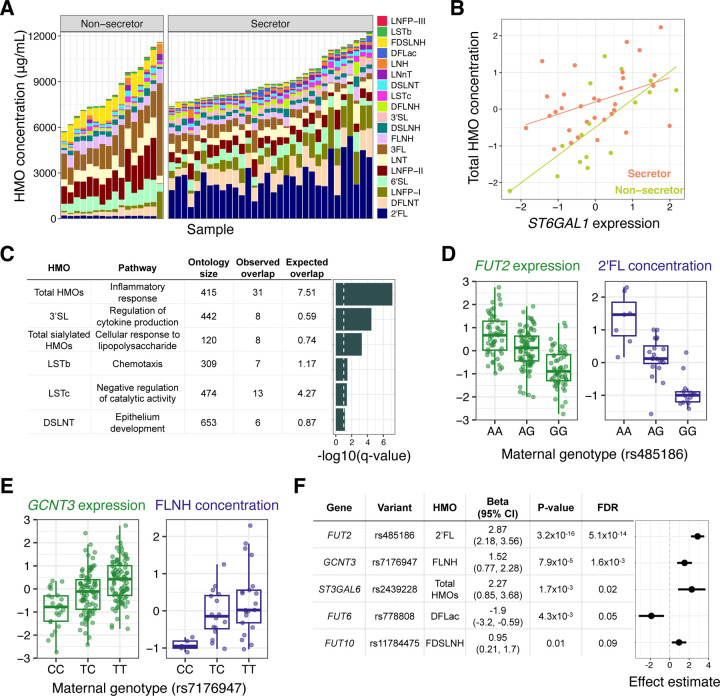
Figure 3. Effects of milk gene expression on HMO composition.
A) HMO concentration profiles (y-axis) for milk samples in our study (x-axis), grouped by secretor status. B) Correlation between ST6GAL1 gene expression in milk and normalized total HMO concentration, colored by secretor status (beta = 0.75, P = 7.2×10⁻⁵, q-value = 0.08.). C) Gene ontology enrichment of genes with expression correlated to a single HMO or HMO category. The most significant term for each HMO is plotted. The dashed vertical line denotes a q-value of 10%. D) Relationships between genotype at the lead SNP at the FUT2 eQTL and FUT2 expression in milk (green) or 2’FL abundance (purple). E) Relationships between genotype at the lead SNP at the GCNT3 eQTL and GCNT3 expression in milk (green) or FLNH abundance (purple). F) Estimates of the effect of milk gene expression of candidate HMO-biosynthesis pathway genes on the abundance of HMOs, from a Wald ratio test. Some genes had significant effects on more than one HMO (Table S11). The most significant HMO for each gene is plotted here.

