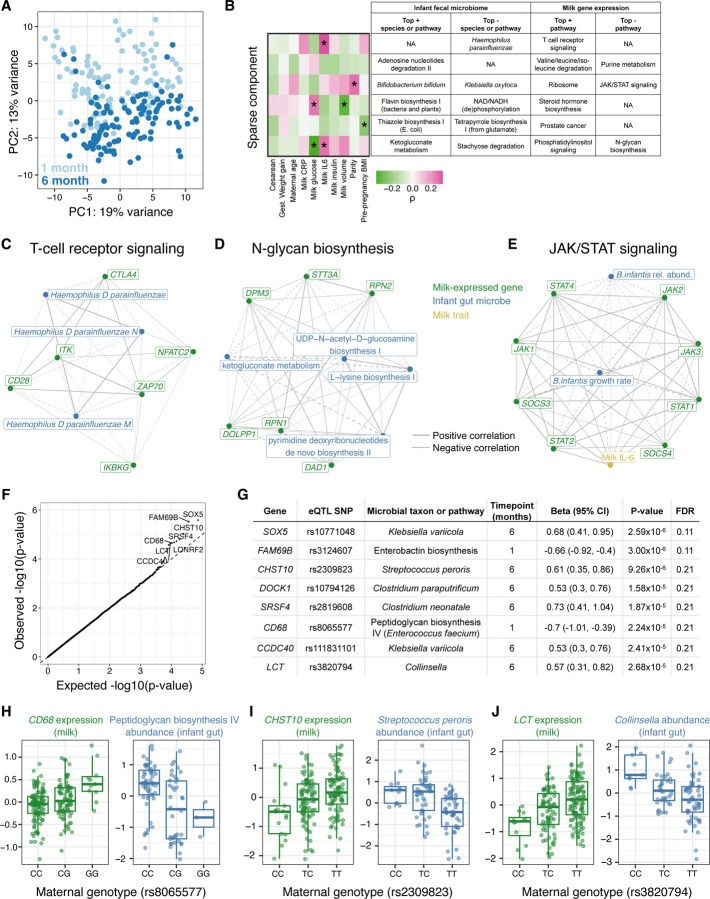
Figure 4. Interactions between milk gene expression and the infant fecal microbiome.
A) Principal components analysis of infant fecal microbiome metagenomic data, summarized at the taxonomic level, with each point representing a fecal sample and colors representing infant age (light blue: 1 month; dark blue: 6 months). B) Sparse canonical correlation analysis integrating milk host gene expression and infant fecal microbial species or microbial gene pathway relative abundances (at 1 month of age) identified six significant sparse components (in rows). The heatmap on the left shows correlation coefficients between each mother/infant pairs’ score for a given sparse component and clinical data (in columns). The table lists the top most highly weighted microbial taxon or genetic pathway, and most significantly enriched host gene set in milk gene expression. (+) or (−) indicates if these features were positively or negatively weighted in the sparse component. C-D) Network diagrams generated using the correlation matrix of infant fecal microbial species/pathways and milk-expressed host genes within an enriched pathway for two of the sparse components in (B). Line size corresponds to the absolute value of correlation coefficient, line type correspond to negative (dashed) or positive (solid) correlations. Node color signifies milk-expressed host genes (green), infant fecal microbial pathways/taxa (green), or milk traits (yellow). E) Network diagram displaying correlations between milk IL-6 concentration, JAK/STAT pathway genes expressed in milk, and Bifidobacterium infantis relative abundance and estimated growth rate in the infant gut at 1 month. JAK/STAT pathway genes were selected that had a significant correlation with either B. infantis trait after multiple test correction (q-value<10%). F) Q-Q plot showing expected (x-axis) vs. observed (y-axis) p-values from association tests between maternal genotype at milk-specific eQTLs and relative abundances of infant fecal microbial taxa/pathways. Top associations are labeled with the gene name. G) Details on 8 associations (rows) between milk eQTL and infant fecal microbe abundance that passed q-value<25%. H-I) Associations between maternal genotype at a milk-specific eQTL with the expression of that gene in milk (green, left), and with the relative abundance of an infant microbiome feature (blue, right).

