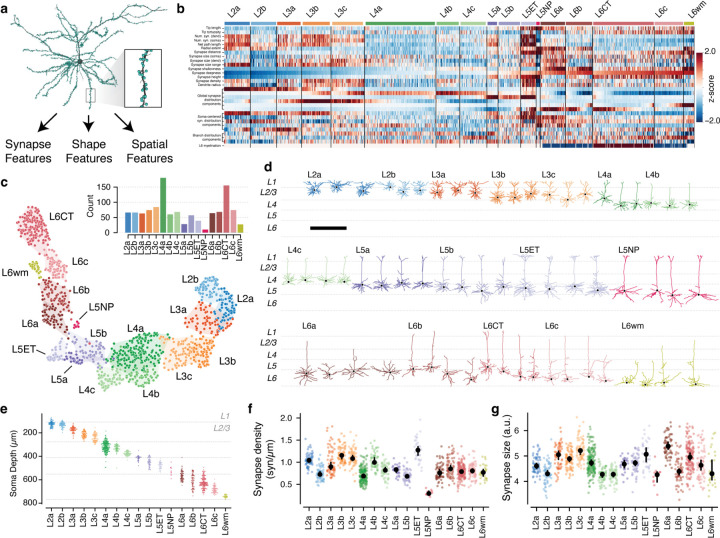
Figure 3.
Data-driven characterization of excitatory neuron morphological types (M-types). a) Morphology (black) and synapse (cyan dots) properties were used to extract features for each excitatory neuron, such as this layer 2/3 pyramidal cell shown. b) Heatmap of z-scored feature values for all excitatory neurons, ordered by anatomical cluster (see text) and soma depth. See Methods for detailed feature descriptions. c) UMAP projection of neuron features colored by anatomical cluster. Inset indicates number of cells per cluster. d) Example morphologies for each cluster. See (Extended Data Fig. 6) for all excitatory neurons. Scale bar is 500 µm . e) Soma depth of cells in each anatomical cluster. f) Median linear density of input synapses across dendrites by M-type. g) Median synapse size (arbitrary units, see Methods). In g and h, colored dots indicate single cells, black dots and error bars indicate a bootstrapped (n=1000) estimate of the median and 95% confidence interval.

