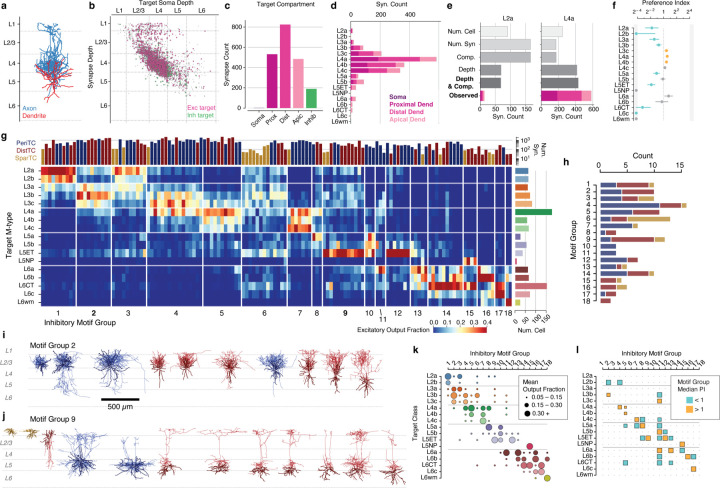
Figure 5.
Inhibitory connectivity groups selectively organize inhibitory connectivity. a–f) Single-cell anatomical connectivity profiles. a Example inhibitory neuron. Axon in blue, dendrite in red. b–e Output connectivity profile of the cell in a. b Scatterplot of synaptic outputs, showing synapse depth (y-axis) vs depth of the postsynaptic soma (x-axis). Purple dots are excitatory, green dots are inhibitory, and gray dots are targets outside the column data. c Distribution of synaptic outputs across target compartments. d Synapse distribution across all potential excitatory types e Observed synapse count onto L2a (left) and L4a cells (right) compared to the expected value from various null models of connectivity (see text). Internal colors for observed data indicate contributions from each compartment. f) The preference index (PI) of each M-type for the example cell. PI is measured as the ratio of the observed synapse count to the depth and compartment-matched null model. Colored dots indicate a statistically significant deviation from a PI of 1 (orange is high, blue is low, lines indicate 95% confidence interval after Holm-Sidak correction for multiple tests), using stratified tables compared across depth bins (see Methods). g) Distribution of synaptic output for all interneurons, organized into common targeting motif groups. Each row is an excitatory target M-type, each column is an interneuron, and color indicates fraction of observed synapses from the interneuron onto the target M-type. Sort order is by motif group and soma depth. h) Cell counts in each motif group, colored by inhibitory subclass. i) All inhibitory cells in motif groups 1 (g) and 8 (j), colored by subclass as in f. Note diversity in both subclasses and individual cells. k) Mean fraction of synapse targeting for each motif group. l) Median selectivity PI within each motif group. Cells with non-significant PIs were considered to be 0.

