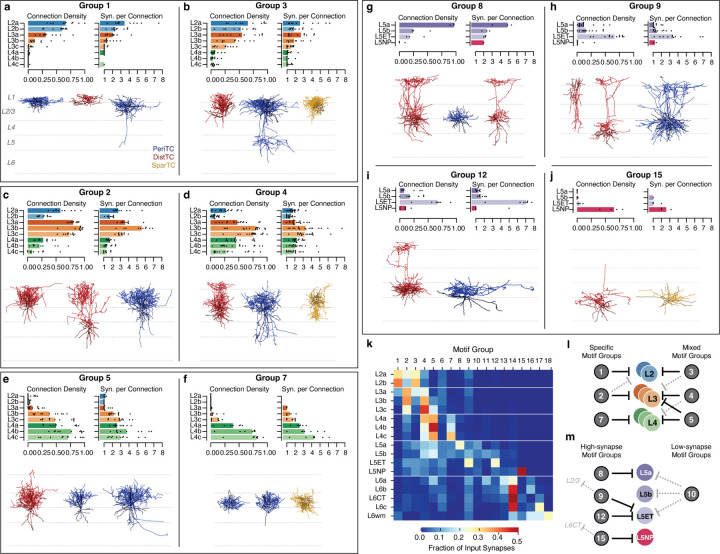
Figure 6.
Inhibitory connectivity groups targeting layers 2–5 make specific, strong connections. a, b) Inhibitory motif groups targeting layer 2: Groups 1 (a) and 3 (b). a) Top row, left: Connection density for Group 1 measured as the fraction of cells of a target M-type that get synaptic input from each cell in the group. Bar indicates median, dots show each cell. Top row, right: Mean number of synapses per connection. Bar indicates median, dots show each cell. Only target M-types from layers 2–4 shown; see Extended Data Cell Atlas for all data. Bottom row: Example morphologies for neurons in the group, colored by cell subclass. Examples were chosen to capture diversity within groups. b) As in a), for Group 3. c, d) Inhibitory motif groups targeting layer 3: Groups 2 (c) and 4 (d), as in a,b. e, f) Inhibitory motif groups targeting layer 4: Groups 5 (e) and f (f), as in a,b. g, j) Inhibitory motif groups targeting layer 5: L5a-targeting Group 8 (g), ET targeting Groups 9 (h) and 12 (i), and NP-targeting Group 15 (j), as in a,b. Here, only target M-types from layer 5 shown. k) Fraction of all measured inhibitory input into each target excitatory M-type, by motif group. l) Schematic of major inhibitory motif groups onto layers 2–4. m) Schematic of major inhibitory motif groups onto layer 5.

