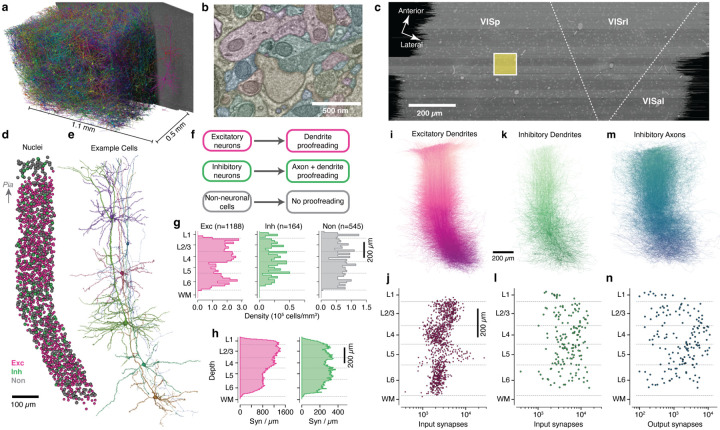
Figure 1.
A columnar reconstruction of mouse visual cortex. a) The millimeter-scale EM volume is large enough to capture complete dendrites of cells across all layers. Neurons shown are a random subset of the volume, with a single example at right for clarity. b) The autosegmented EM data reveals ultrastructural features such as membranes, synapses, and mitochondria. c) Top view of EM data with approximate regional boundaries indicated. The yellow box indicates the 100 μm × 100 μm column of interest. d) All nuclei within the column colored by cell class. e) Example neurons from along the column. Note that anatomical continuity required adding a slant in deeper layers. f) Proofreading workflow by cell class. g) Cell density for column cells along cortical depth by cell class. h) Input synapse count per μm of depth across all excitatory (purple) and inhibitory (green) column cells along cortical depth by target neuronal cell class. i) All excitatory dendrites, with arbors of cells with deeper somata colored darker. Same orientation as in d. j) Number of input synapses for each excitatory neuron as a function of soma depth. k) As in j, but for inhibitory neurons. l) As in k, but for inhibitory neurons. m) As in j, but for the proofread axons of inhibitory neurons. n) As in k, but for number of synaptic outputs on inhibitory neuron axons.

