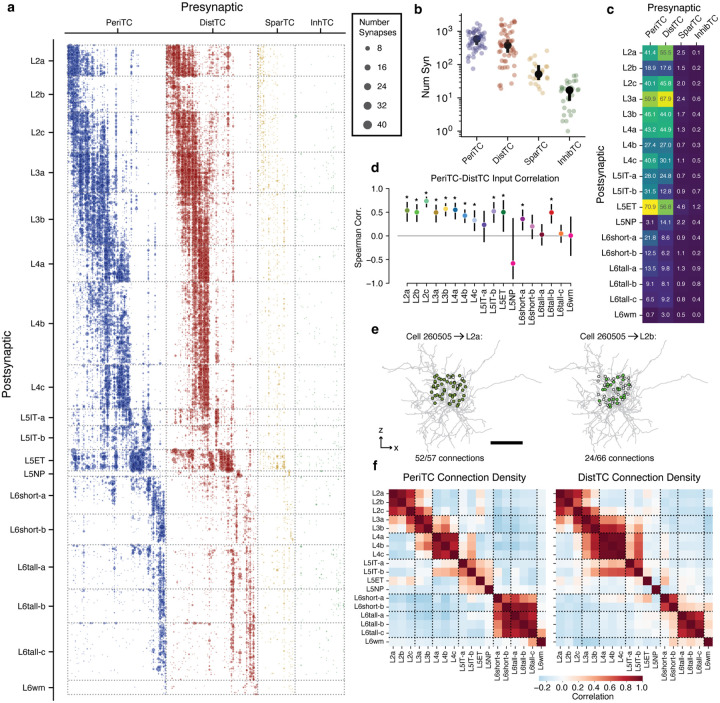
Figure 4.
Inhibition of excitatory neurons. a) Connectivity from all inhibitory neurons (columns) onto all excitatory neurons, sorted by M-type and soma depth. Dot size indicates net number of synapses observed. b) Net synapses onto column cells for each inhibitory subclass. Black dots indicate median, bars show 5% confidence interval. c) Mean net synapses per target cell from each inhibitory subclass onto each excitatory M-type. d) Spearman correlation of PeriTC and DistTC net input onto individual cells, measured within each M-type. Bars indicate 95% confidence interval based on bootstrapping (n=2000). Stars indicate M-types significantly different from zero with a p-value < 0.05 after Holm-Sidak multiple test correction. e) Example of connectivity density calculation. Connectivity density from a single interneuron (gray) onto all cells within two example M-types (left: L2a right, L2b). Potential target cell body positions shown as dots, filled if synaptically connected and gray otherwise. Scale bar is 100μm. f) Pearson correlation of connectivity density between excitatory M-types, based on PeriTCs (left) and DistTCs (right). Dotted lines indicate groups of cells roughly within a layer.

