
Figure 5. Kenyon cells with reduced claw numbers are less responsive to odors.
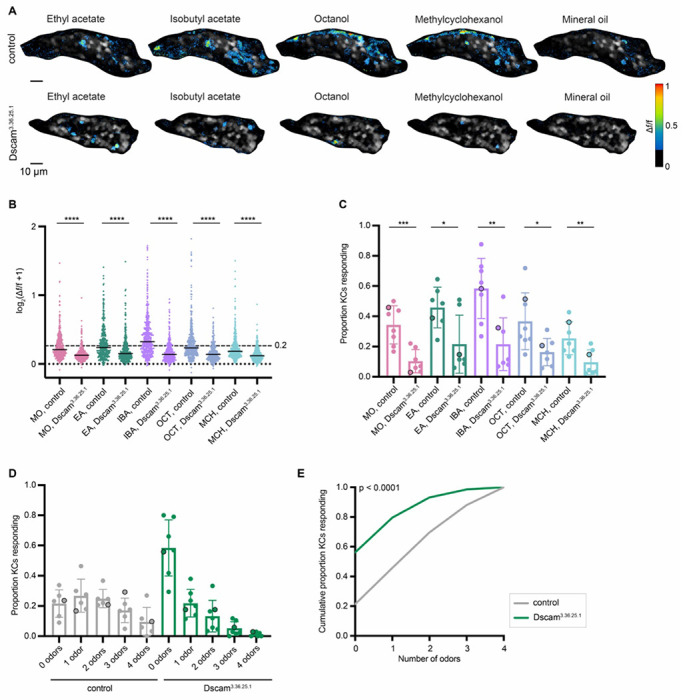
(A) Example KC somatic odor responses in control hemisphere and KC>Dscam3.36.25.1 (decreased dendrite condition) hemisphere. Grayscale indicates the cells. Δf/f scale is shown such that all cells with responses < 0.2 are colored black, responses > 1 are colored red. See also Figure S5 for odor response traces over time for this image. (B) Peak odor responses of all cells, aggregated from all analyzed samples. Y axis displays log2-scaled Δf/f values. Dashed line indicates 0.2 Δf/f threshold. Dotted line indicates Δf/f = 0. Black horizontal bars show medians. Significance: Mann-Whitney test. n = 380-428 control cells, 372 Dscam3.36.25.1 cells for each odor. (C) Proportion of cells in each sample responding to each odor above 0.2 Δf/f threshold. Significance: unpaired t-test. (D) For samples in which the same cells could be tracked across all odor presentations, fraction of cells responding to 0, 1, or multiple odors is shown. Bar plots in (C,D) show mean ± SD, and black circled data points correspond to the images shown in (A). (E) Cumulative proportion of cells responding from 0 up to 4 odors. Lines represent mean of all control (gray; n = 369) and Dscam3.36.25.1 cells (green; n = 338). Significance: Kruskal-Wallis test; K-S distance = 0.348.