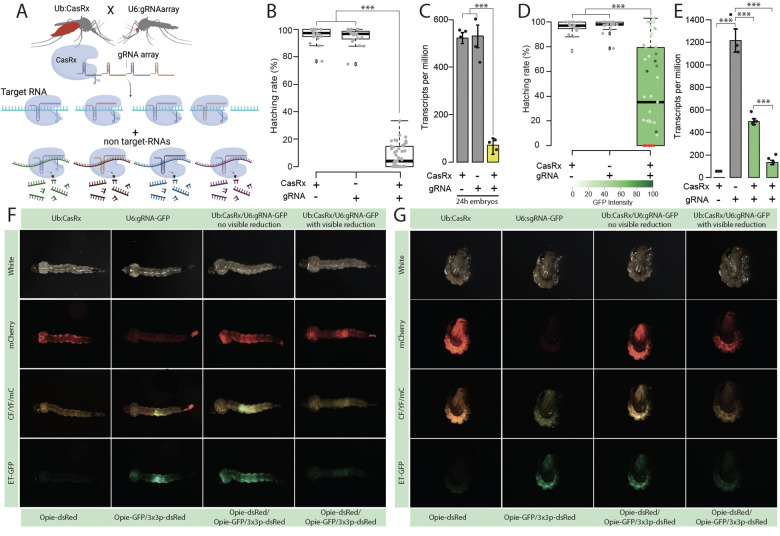
Fig. 1. Assessment of transcript reduction mediated by CasRx.
(A) Schematic representation of the binary system used for the proof-of-concept studies evaluating the candidate target genes. The lines are composed of CasRx and a gRNA array targeting the gene of interest inducing collateral cleavage of bystander RNAs. (B) Hatching rate of parental lines and transheterozygotes targeting yellow. (C) Relative expression measured by qPCR in control and transheterozygotes embryos (D) Hatching rate of parental lines and transheterozygotes targeting EGFP. Phenotype penetrance is depicted by green shading in the box plot, with colors ranging from light green (low EGFP levels) to dark green (high EGFP levels). Red dots represent dead individuals and thus non quantifiable EGFP. Asterisks indicate a significant reduction in the hatching rate in transheterozygotes by one-way ANOVA with Tukey’s multiple-comparison test (*** P < 0.001). (E) Relative expression measured by qPCR in control and transheterozygote larvae in EGFP. The two transheterozygote groups represent larvae with no visible reduction in EGFP and with visible reduction of EGFP, respectively. asterisks indicate significant differences by one-way ANOVA with Tukey’s multiple-comparison test (***P < 0.001), (F and G) EGFP reduction at larval and pupal stages, respectively. mCherry represents the red fluorescent filter, ET-EGFP represents the green fluorescent filter, and CF/YF/mC represents the triple hybrid filter for detecting blue, yellow, and red fluorescence.

