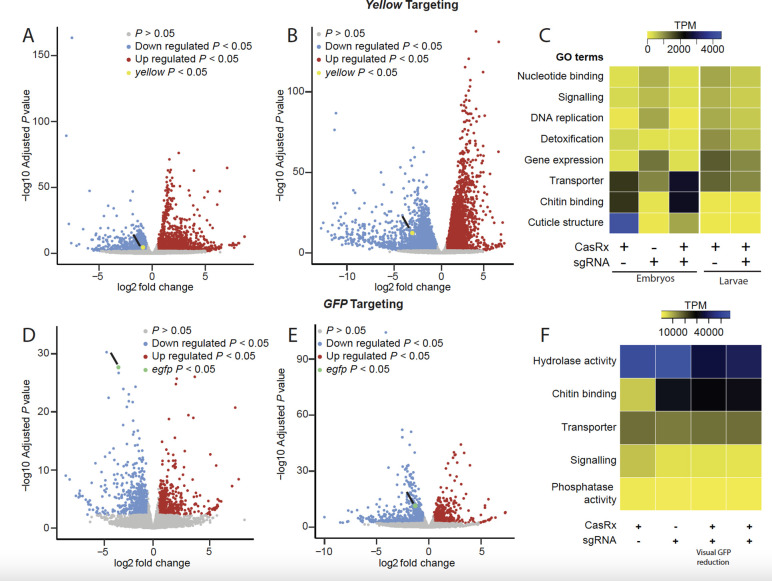
Fig. 2. Transcriptome differential expression analysis.
(A) RNAseq results in 24–hr-old eggs and (B) in third instar larvae comparing transheterozygotes targeting yellow to the CasRx expressing control line. Blue dots represent downregulated genes with P < 0.05, and red dots represent overexpressed genes with P < 0.05. (C) Heat map of gene functions with the two-fold difference in expression level among different treatments and FDR < 0.05 when targeting the yellow gene. Expression levels are represented by colors ranging from yellow (lowest expression) to blue (highest expression) (D) RNAseq results in third instar larvae with a visible EGFP reduction and (E) in the third instar larvae that do not show visible EGFP reduction comparing transheterozygotes targeting GFP to CasRx expressing control line. Blue dots represent downregulated genes with P < 0.05 and red dots represent overexpressed genes with P < 0.05. (F) Heat map of gene functions with the two-fold difference in expression level among different treatments and FDR < 0.05 when targeting EGFP transgene. Expression levels are represented by colors ranging from yellow (lowest expression) to blue (highest expression).

