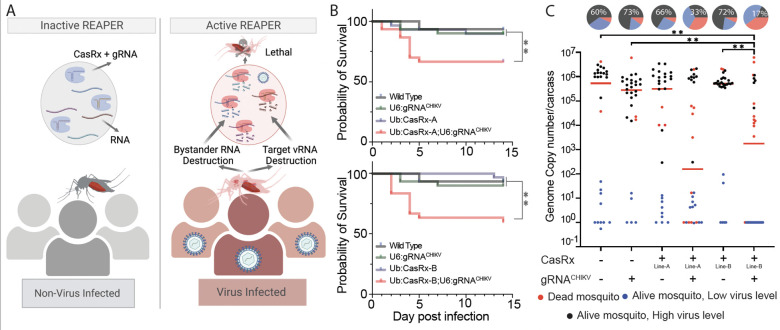
Fig. 4. Viral challenge assays.
(A) Schematics representation of the REAPER system. REAPER remains inactive in uninfected mosquitoes and is activated in the presence of the targeted virus. Once activated, REAPER induces degradation of viral RNA with additional collateral cleavage of bystander RNAs, leading to lethality. (B) Adult survival curves (log-rank Mantel-Cox test) of virus exposed females per treatment. Asterisks represent significant differences in survival between treatments(*P < 0.05; **P < 0.001). (C) The viral genome copy number and infection prevalence of CHIKV, were measured 14 days after an infected blood meal challenge (n = 30). qRT-PCR was used to assess genome copy number and infection prevalence in individual mosquitoes, with each dot representing the viral load from individual mosquitoes. Each pie-chart indicates the percentage of mosquitos that died by day 5 (in red), that are alive but with lower virus level of ≤102 (blue), or that have an high virus level (black). Lines A and B represent different CasRx lines (Table S2). Horizontal red lines indicate the median of the viral loads. Considering the non-normal distribution of viral titers, the median was used to describe central tendency. The nonparametric Mann-Whitney test was used to compare median viral titers, and Fisher’s exact test was used to compare infection prevalence. *P < 0.05, **P < 0.01, ****P < 0.0001.

