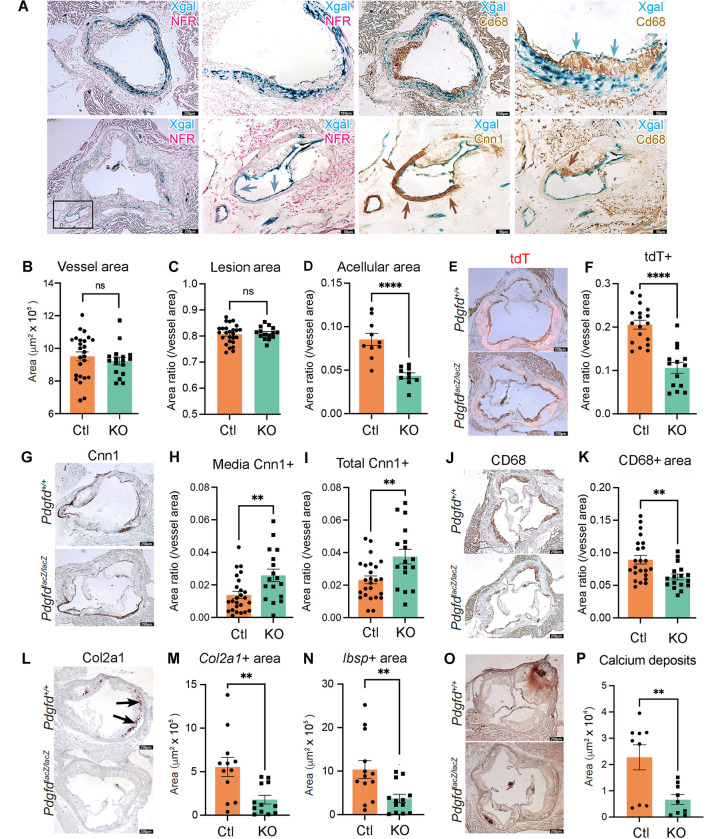
Figure 5. In situ studies of mouse atherosclerosis reveal that Pdgfd KO lessens SMC cell state transitions and inflammation but without impact on plaque burden.
(A) X-gal staining visualizing β-galactosidase activity (lacZ, blue precipitate) to determine the cellular location of Pdgfd expression in mouse model atherosclerosis. Aortic root sections were also stained with a generic nuclear marker nuclear fast red (NFR), immunohistochemistry for the Cd68 macrophage marker or Cnn1 marker for SMC identification. (B) Quantification of total vessel area. (C) Quantification of lesion, and (D) acellular areas in Ctl and KO groups expressed as a ratio of the total vessel area per section. (E) Representative images identifying expression of the tdTomato gene to visualize the SMC lineage traced cells in aortic sections. (F) Quantification of tdTomato positive (tdT+) area relative to total vessel area. (G) Representative sections stained for Cnn1, a marker of the differentiated SMC. (H) Quantification of Cnn1 positive (Cnn1+) area at the media, and (I) compared to total cross-sectional area expressed as a ratio of the total vessel area per section. (J) Representative images of Cd68-stained aortic root area to quantify monocyte recruitment. (K) Quantification of Cd68 positive (Cd68+) area relative to the vessel area. (L) Representative images of Col2a1 RNAscope of the aortic root in Ctl and KO mice. (M) Quantitative RNAscope of Col2a1 and (N) Ibsp expression. (O) Representative images stained for calcium deposits with alizarin Red S. (P) Quantification of calcium deposits. Each dot represents quantification from identical level sections from individual animals. Data expressed as mean ± s.e.m with p-values using an unpaired t-test. ** p<0.01, *** p<0.001.

