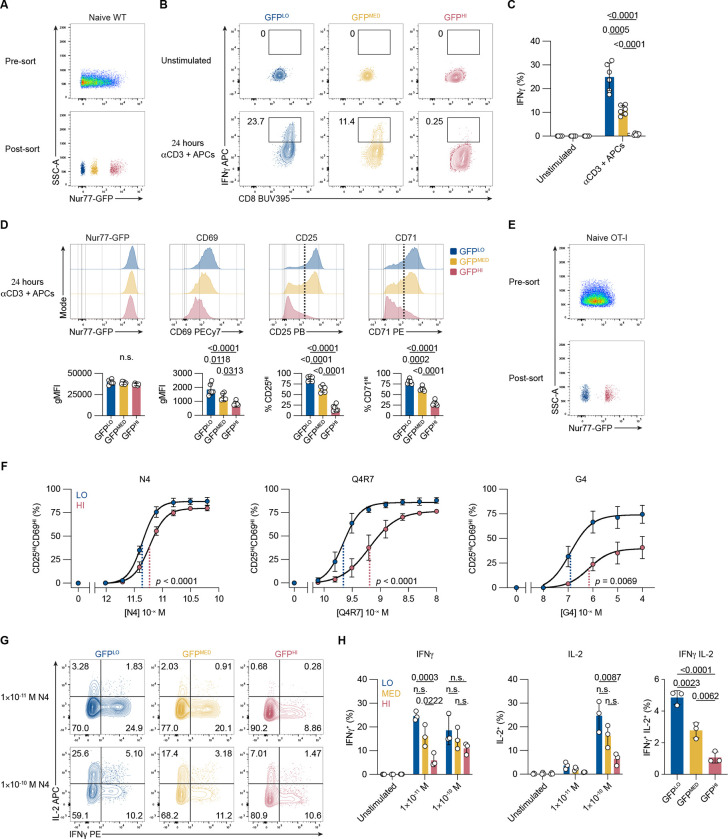
Figure 2. Accumulative steady-state TCR signaling correlates negatively with naive CD8 T cell responsiveness.
(A) Representative flow cytometry plots show GFP fluorescence of total CD8+ cells (top) and sorted GFPLO, GFPMED, and GFPHI naive, polyclonal CD8 T cell populations (bottom). (B) Contour plots depict CD8 and IFNγ expression by unstimulated and stimulated viable polyclonal CD8+ T cells after a 45 min IFNγ-secretion assay. Numbers indicate the percentage of cells within the indicated gates. (C) Bar graph displays the frequencies of GFPLO, GFPMED, and GFPHI IFNγ-secreting cells. Cells were either unstimulated or stimulated for 24 hours with 0.25 μg/ml anti-CD3 and APCs before the secretion assay. Values are shown from three independent experiments. (D) Histograms show expression of the indicated activation markers of cells stimulated for 24 hours with 0.25 μg/ml anti-CD3. Cells were gated on viable CD8+ T cells. Bar graphs display the gMFI for Nur77-GFP and CD69 or the frequency of marker-positive cells for CD25 and CD71 (as indicated by the dotted line in the histogram). (E) Representative flow cytometry plots show GFP fluorescence for total naive OT-I CD8+ T cells pre-sorting (top), and FACS-sorted GFPLO and GFPHI cells (bottom). (F) Graphs show the frequencies of CD25HICD69HI cells after 16 hours of stimulation with indicated peptide concentrations and APCs. Plotted are mean values from three independent experiments fitted by non-linear regression curves. The dotted lines indicate the Log10 half maximal effective concentration (EC50) for GFPLO (blue) and GFPHI (red) cells. The p-value indicates the t test for the Log10EC50 (the null hypothesis being that the Log10EC50 is the same for the two populations). (G) Contour plots depict viable CD8+ T cells after a 45-minute assay of IFNγ- and IL-2-secretion of unstimulated or stimulated (16 hours) OT-I CD8+ T cells. (H) Bar graphs show the frequencies of IFNγ, IL-2, or IFNγ and IL-2-secreting cells after 16 hours of stimulation with indicated N4 peptide concentrations and APCs or unstimulated control. Values are shown from three independent experiments. All data represent three independent experiments with n = 3 mice (E, F, G, H) or n = 6 mice (A, B, C, D). Bars in C, D, and H depict the mean, and error bars show ± s.d. Statistical testing in C was performed by one-way analysis of variance (ANOVA) (p < 0.0001) followed by Tukey’s multiple comparisons test indicated in the graph. Statistical testing in D was performed by ANOVA (p < 0.0001 for CD69, CD25, and CD71) followed by Tukey’s multiple comparisons test. Statistical testing in H was performed by unpaired two-tailed Student’s t test. n.s., not significant.

