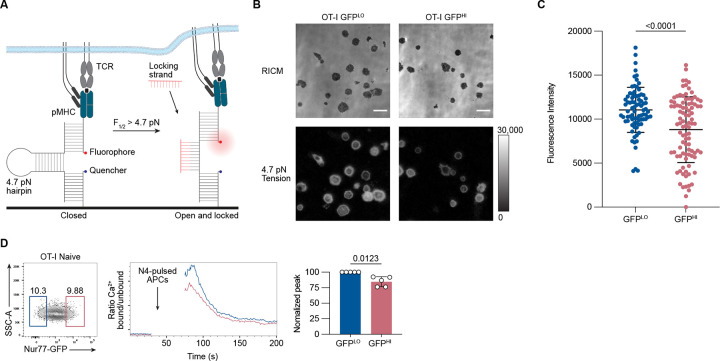
Figure 3. Nur77-GFPHI CD8+ T cells exert less TCR-mediated tension forces and exhibit attenuated proximal TCR signaling.
(A) Schematic outline of the DNA hairpin-based tension probe. In its closed conformation, the fluorescence of Cy3B is quenched. The DNA hairpin unfolds when TCR-mediated tension exceeds 4.7 piconewtons (pN). A “locking” DNA strand that hybridizes to the mechanically unfolded probe stabilizes the unfolded conformation of the DNA hairpin. (B) Representative Reflection Interference Contrast Microscopy (RICM) and fluorescence images showing GFPLO and GFPHI (top and bottom 10%) OT-I CD8+ T cells spread on DNA hairpin tension probe coated surfaces after 30 minutes. (C) Graph displays the unquenched fluorescence intensities of the unfolded tension probes for 81–94 cells. Each dot represents one cell. (D) Contour plot shows the distribution of Nur77-GFP fluorescence intensity for CD8+ CD44LO OT-I T cells. Numbers indicate the percentages of cells within the indicated gates, representing GFPLO and GFPHI cells (left). Histogram shows the relative concentration of free Ca2+ over time. Shown are the mean values for GFPLO and GFPHI naive OT-I CD8+ T cells (middle). Baseline Ca2+ levels were recorded for 30 seconds, and the arrow indicates the time point when the T cells were mixed with N4-pulsed APCs, centrifuged, and resuspended before the continuation of data acquisition. The bar graph shows the normalized peak intracellular free Ca2+ values during ten seconds of GFPLO and GFPHI cells ~70 seconds after the initial acquisition (right). Data represent two (C) to three (D) independent experiments with n = 2 mice (C) or n = 5 mice (D). Bars in C and D depict the mean, and error bars show ± s.d. Statistical testing was performed by unpaired two-tailed Student’s t test with Welch’s correction.

