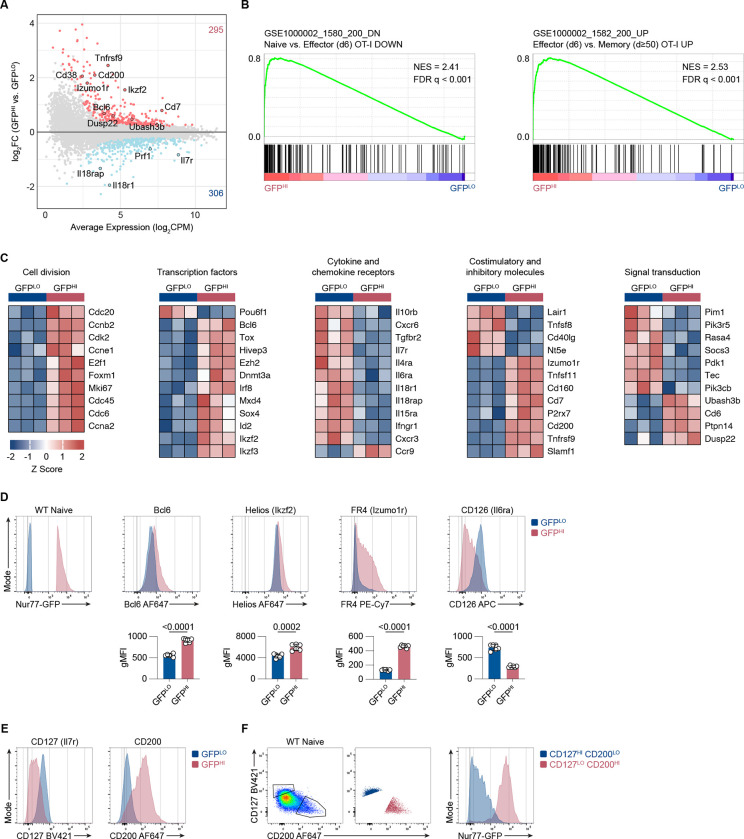
Figure 4. Nur77-GFP expression in naive CD8+ T cells during steady-state conditions correlates with gene expression changes.
(A) MA plot of DEGs between GFPLO and GFPHI naive OT-I CD8+ T cells. DEGs were defined as genes with an FDR < 0.05. Selected genes have been highlighted. The number of upregulated and downregulated genes in GFPHI relative to GFPLO cells are indicated in red and blue, respectively. (B) GSEA of genes downregulated in naive compared to effector CD8+ T cells (left panel) and genes upregulated in effector compared to resting memory CD8+ T cells (right panel) (Luckey et al., 2006). FDR values were derived from running GSEA on the c7_Immunesigdb.v2022.1 database. (C) Curated heatmaps of normalized expression of DEGs in indicated categories. (D) Histograms show expression of the indicated markers by GFPLO and GFPHI cells. The cells were gated on naive, polyclonal CD8+ T cells. Bar graphs depict gMFI of indicated proteins. (E) Flow cytometry plots of CD127 and CD200 expression in naive GFPLO and GFPHI naive, polyclonal CD8+ T cells as in D. (F) Flow cytometry plots (left, middle) show the gating scheme to identify CD127HI CD200LO and CD127LO CD200HI populations. Histogram (right) shows the GFP fluorescence intensity for CD127HI CD200LO and CD127LO CD200HI populations. Plots depict naive, polyclonal Nur77-GFP CD8+ T cells. Data represent two (D) to three (E and F) independent experiments with n = 6 mice (D) or n = 3 mice (E and F). Bars in D depict the mean, and error bars show ± s.d. Statistical testing was performed by unpaired two-tailed Student’s t test. NES, normalized enrichment score.

