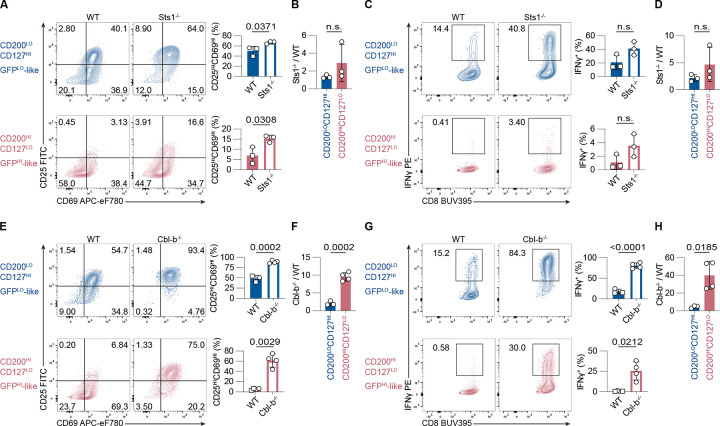
Figure 5. Sts1 and Cbl-b contribute to the attenuated responsiveness of naive Nur77-GFP CD8+ T cells.
(A and E) Contour plots depict CD25 and CD69 upregulation in naive, polyclonal GFPLO-like and GFPHI-like CD8+ T cells stimulated for 24 hours with 0.25 μg/ml anti-CD3 and APCs. Numbers indicate the percentage of cells within each quadrant. Bar graphs depict the frequencies of CD25HICD69HI cells from three to four independent experiments. (B and F) Bar graphs show the ratio of %CD25HICD69HI Sts1−/− cells (in B) or Cbl-b−/− cells (in F) to %CD25HICD69HI WT cells, within GFPLO-like (blue) and GFPHI-like (red) populations. (C and G) Contour plots of IFNγ-secretion of CD8+ T cells stimulated as in A and E, after a 45-minute IFNγ-secretion assay. Numbers indicate the frequency of cells within the IFNγ+ gate. Bar graphs show the percentages of IFNγ+ cells from three to four independent experiments. (D and H) Bar graph shows the ratio of the frequencies of Sts1−/− (in D) or Cbl-b−/− (in H) versus WT IFNγ-secreting cells within the GFPLO-like (blue) and GFPHI-like (red) cell populations. Some of the WT data points for experiments in A, C, E, and G overlap since two experiments with Sts1−/− and Cbl-b−/− T cells were conducted simultaneously. Overlapping WT data points are labeled with squares instead of circles. Data represent three to four independent experiments with n = 3–4 mice. All bars depict the mean and error bars depict ± s.d. Statistical testing was performed by unpaired two-tailed Student’s t test in A, C, E (upper panel), F, and G (upper panel). Statistical testing was performed by unpaired two-tailed Student’s t test with Welch’s correction in B, D, E (lower panel), G (lower panel), and H. n.s., not significant.

