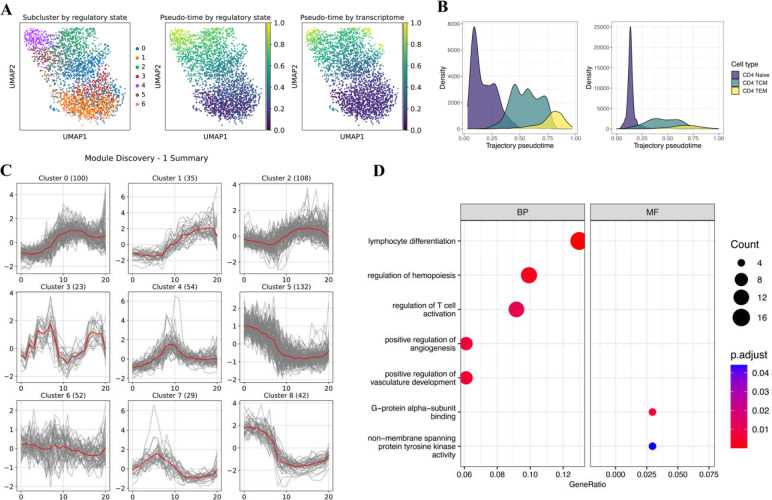
Figure 3.
Heterogeneity analysis on CD4+ T cells. (A) UMAP labeled by subclusters (left), trajectory pseudo-time (middle) derived from regulatory state, trajectory pseudo-time (right) derived from the transcriptome. (B) Density plots showing the pseudo-time distribution in regulatory state and transcriptome-derived trajectory, grouped by cell sub-types. (C) Visualization of the self-organizing map (SOM) optimization results. It demonstrates the features modules found by SOM. (D) Gene Ontology enrichment results of genes in clusters 5 and 8. Size represents the number of genes; color represents the adjusted p-value.

