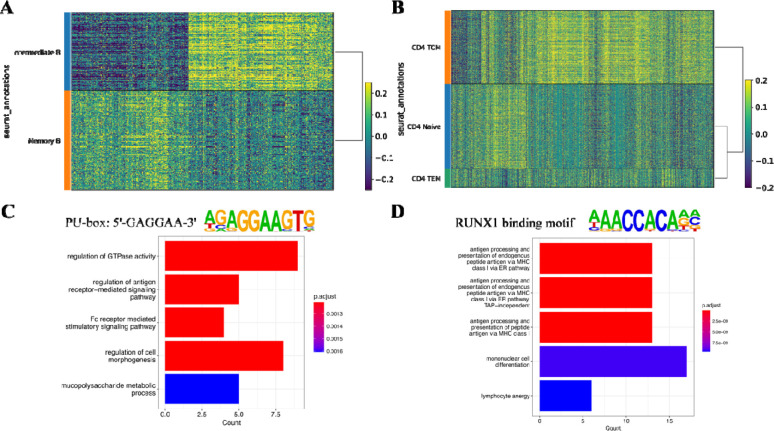
Figure 4.
Markers discovery on 10X Multiome PBMC dataset. (A) Heatmap showing the gene-peak correlations in pseudo-bulk data of B cell clusters. Each row is a pseudo-bulk, each column is a gene-peak pair, and color indicates the correlation level. (B) Heatmap showing the gene-peak correlations in pseudo-bulk data of CD4+ T cell clusters. (C) Differentially correlated peaks in B cell clusters were enriched in PU-box binding motif. Genes linked with the peaks were extracted for Gene Ontology enrichment analysis to discover the functional changes. (D) Differentially correlated peaks in CD4+ T cell clusters were enriched in the RUNX1 binding motif. Genes linked with the peaks were extracted for Gene Ontology enrichment analysis to discover the functional changes.

