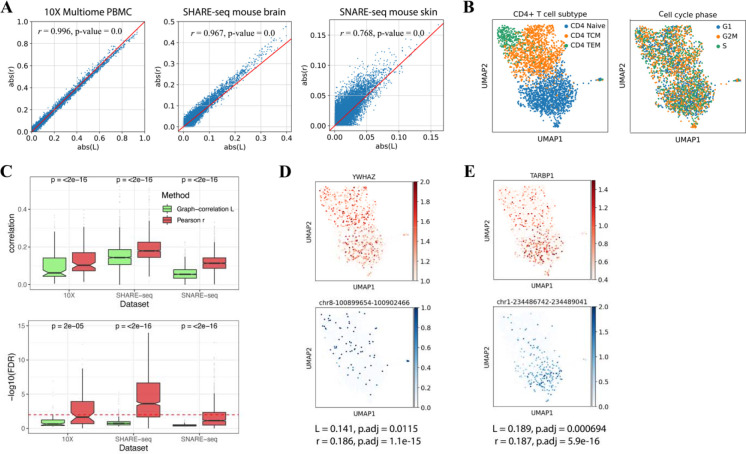
Figure 5.
Comparison between Pearson’s coefficient r and global L index. (A) The consistency between L and r in studying the general trend of regulatory relationships. The scatter plots showed all gene-peak pairs correlation levels measured with r (y-axis) and L (x-axis). The consistency between r and L was tested significantly by Pearson correlation (results shown in the plots). (B) UMAP visualization of CD4+ T cells labeled by T cell subtype (left) and cell cycle phase (right). (C) Box plots showing the correlation level (top) and significance test FDR (bottom) measured by L and r, between cell cycle genes and their nearby peaks. (D) UMAP visualization of cell cycle gene YWHAZ (top), and its cis-regulatory element chr8-100899654-100902466 (bottom), (E) immune-related gene TARBP1 (top), and its cis-regulatory element chr1-234486742-234489041 (bottom). The two pairs have similar Pearson correlations but because of the pattern in data structure, their L index and significant test differ.

