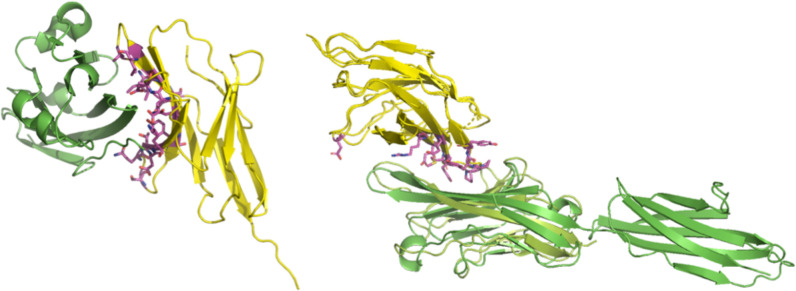
Figure 2:
PD1-PDL1 and CTLA4-CD80 cognate complexes. PD1 is shown in yellow and PDL1 is shown in green (left). CTLA4 is shown in yellow, CD80 is shown in dark green, and CD86 is shown in light green (right). Interface residues on CTLA4 (for CTLA4-CD80 complex) are shown as sticks. Visualization rendered in Pymol.

