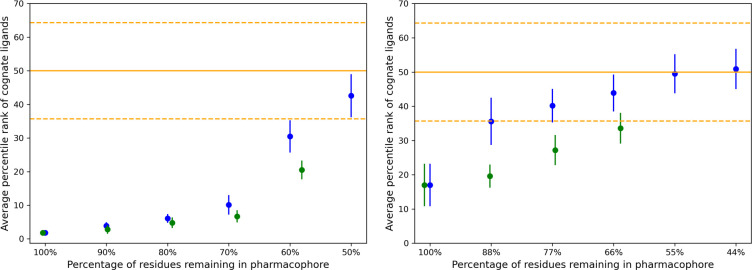
Figure 7:
Assessment of recognizing the cognate ligand (CD80 (left) and CD86 (right)) of CTLA4 receptor interface. Average percentile rank of cognate ligands is shown (Y-axis) as a function of gradually reduced interfaces (X-axis). Blue and green points represent all and only reliable data points, respectively with the corresponding standard error of the mean shown by vertical lines. The orange solid line shows the random expectations for average rank of cognate ligands, and orange dashed line shows the standard deviation.

