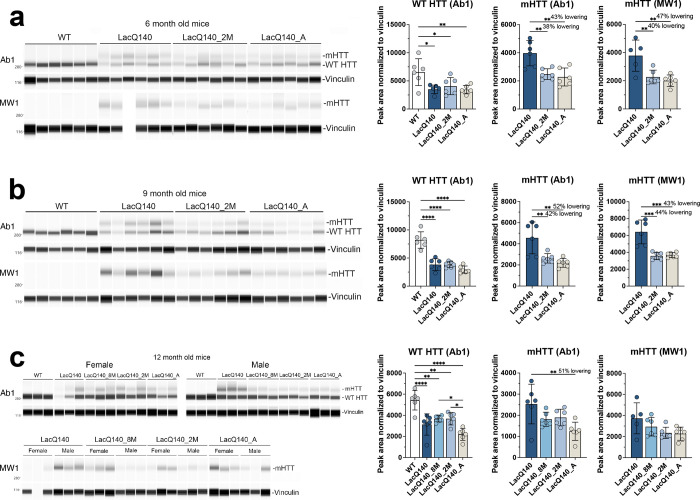
Figure 2. Analysis of mHTT protein levels in crude homogenates of 6-, 9- and 12-months old mice.
HTT levels were analyzed by capillary immunoassay on equal amounts of protein (0.6 μg) using anti-HTT antibody Ab1 and anti-polyQ antibody MW1 (a). Peak area analysis performed using Compass software in 6-month-old mice shows a significant decrease in WT HTT as detected with Ab1 in all LacQ140 mice compared to WT mice (F(3, 20) = 5.674, **P=0.0056, One-way ANOVA with Tukey’s multiple comparison test, n=6). mHTT levels are significantly lower in LacQ140_2M and LacQ140_A as detected with both Ab1 and MW1 compared to LacQ140 (a, Ab1: F(2, 15) = 11.25, **P=0.0010, −38% and −43% respectively; MW1: F(2, 14) = 9.879, **P=0.0021, −40% and −47% respectively). Peak area analysis in 9-month-old mice shows a significant decrease in WT HTT as detected with Ab1 in all LacQ140 mice compared to WT mice (F(3, 20) = 34.67, ****P<0.0001, One-way ANOVA with Tukey’s multiple comparison test, n=6). mHTT levels are significantly lower in LacQ140_2M and LacQ140_A, as detected with both Ab1 and MW1, compared to LacQ140 (b, Ab1: F(2, 15) = 10.82, **P=0.0012, −42% and −52% respectively; MW1: F(2, 15) = 20.82, ****P<0.0001, −44% and −43% respectively). Peak area analysis in 12-month-old mice shows a significant decrease in WT HTT as detected with Ab1 in all LacQ140 mice compared to WT mice (F(4, 25) = 15.81, ****P<0.0001, One-way ANOVA with Tukey’s multiple comparison test, n=6). WT HTT was significantly lower in LacQ140_A compared to LacQ140_8M and LacQ140_2M mice. mHTT levels are significantly lower in LacQ140_A mice, as detected with Ab1, compared to LacQ140 (c, Ab1: F(3, 20) = 5.017, **P=0.0094, −51%, One-way ANOVA with Tukey’s multiple comparison test, n=6). Asterisks on graphs represent Tukey’s multiple comparison test, n=6 mice per group (*p<0.05, **p<0.01, ***p<0.001, ****p<0.0001).

