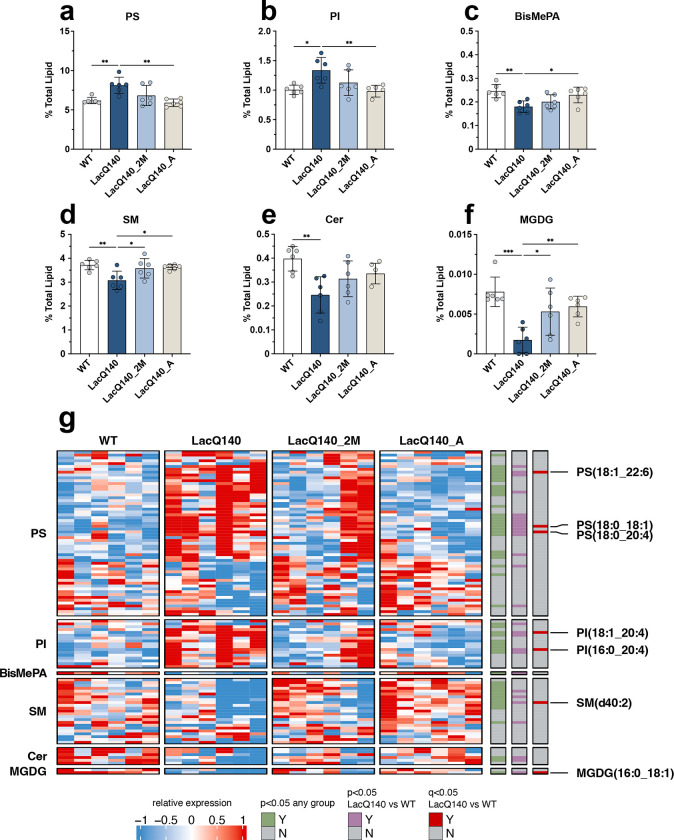
Figure 5. Restoration of dysregulated lipid subclasses with lowering of mHtt.
Graphs show relative intensities for lipid subclasses expressed as a percent of total lipid intensity detected (bars = mean, error bars = ± SD). (a) PS increased in LacQ140 mice and is reversed in LacQ140_A mice; F(3, 20) = 7.601, **P=0.0014, q=0.0125, (b) PI increased in LacQ140 mice and reversed in LacQ140_A mice; F(3, 20) = 5.707, **P=0.0054, q=0.0168, (c) BisMePA decreased in LacQ140 mice and is reversed in LacQ140 mice; F(3, 20) = 6.086, **P=0.0041, q=0.0168, (d) SM decreased in LacQ140 mice and is reversed in LacQ140_2M and LacQ140_A mice; F(3, 20) = 5.465, **P=0.0066, q=0.0168, (e) Cer decreased in LacQ140 mice; F(3, 20) = 5.883, **P=0.0048, q=0.0168, (f) MGDG decreased in LacQ140 mice and is reversed in LacQ140_2M and LacQ140_A mice; F(3, 20) = 9.350, ***P=0.0005, q=0.0089. Statistics are one-way ANOVA and asterisks on graphs represent Tukey’s multiple comparison test, n=6 mice per group. (g) Heatmap shows individual lipid species that comprise each subclass. Hierarchical clustering was performed across individual lipid species (rows) and animals (columns) using the one minus Pearson correlation distance metric. Individual lipid species significantly changed between any group are indicated in green (p<0.05, one-way ANOVA), lipid species significantly changed between LacQ140 and WT are indicated in purple (p<0.05, one-way ANOVA, n=6) and red (q<0.05, one-way ANOVA & two-stage linear step-up procedure of Benjamini, Krieger, and Yekutieli, N=632 lipid species, n=6 mice). Source data and full statistical details can be found in Additional Files 1, 4, & 5.

