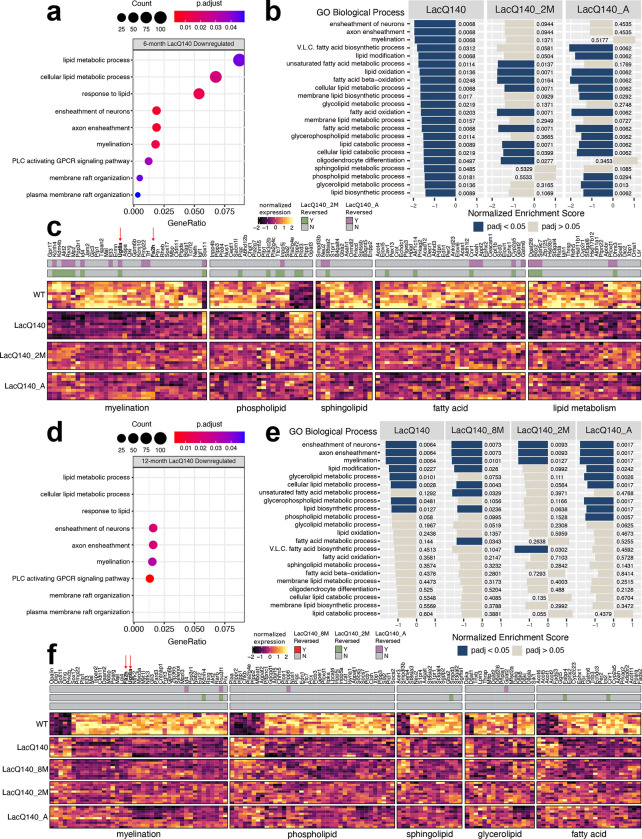
Figure 6. Lipid metabolism and myelin associated transcriptional changes and reversal with mHtt lowering.
(a) Dotplot (clusterProfiler) of lipid or myelin related GO BP terms overrepresented (one sided hypergeometric test, padj<0.05) in 6-month LacQ140 downregulated genes (padj<0.05, FC>20%). GeneRatio represents the number of genes associated with each GO term/number of downregulated genes. Dots are sized by count of genes associated with respective terms. (b) Gene set enrichment analysis (clusterProfiler) of 6-month LacQ140, LacQ140_2M and LacQ140_A groups compared to WT. All lipid and myelin associated GO BP terms significantly enriched in LacQ140 compared to WT (padj<0.05) are displayed. X axis for each respective group represents the normalized enrichment score (NES) and bars are colored by significance (padj<0.05 = blue, padj>0.05 = tan). Adjusted p-values are displayed adjacent to bars. (c) Heatmap shows differentially expressed genes in 6-month-old LacQ140 mice compared to WT (padj<0.05, FC > ±20%). Gene expression is shown as median ratio normalized counts (DESeq2), scaled by respective gene (columns). Bars above the heatmap indicate DEGs reversed with mHtt lowering. LacQ140_2M = green, LacQ140_A = purple; padj<0.05, FC > 20% opposite of LacQ140. (d) Dotplot of lipid or myelin related GO BP terms overrepresented in 12-month downregulated genes. GO BP terms significantly overrepresented at 6-months (a) are displayed for comparison. 4/9 terms (ensheathment of neurons, axon ensheathment, myelination, and phospholipase C activating G-protein coupled receptor signaling pathway) are significantly overrepresented in 12-month LacQ140 downregulated genes (one sided hypergeometric test, padj < 0.05). (e) Gene set enrichment analysis of LacQ140, LacQ140_8M, LacQ140_2M and LacQ140_A groups compared to WT. GO BP terms enriched at 6-months (b) are displayed for comparison. 8/22 GO BP terms are significantly negatively enriched (padj < 0.05) at 12-months, shown in blue. (f) Heatmap shows differentially expressed genes in 12-month-old LacQ140 mice compared to WT (padj<0.05, FC > ±20%). Gene expression is shown as median ratio normalized counts (DESeq2), scaled by respective gene (columns). Bars above the heatmap DEGs reversed with mHtt lowering (LacQ140_8M = bottom bar, no reversal, LacQ140_2M = green, LacQ140_A = purple; padj<0.05, FC >20% opposite of LacQ140). GO BP terms associated with genes, fold changes, and exact FDR values can be found in Additional Files 2 & 3.

