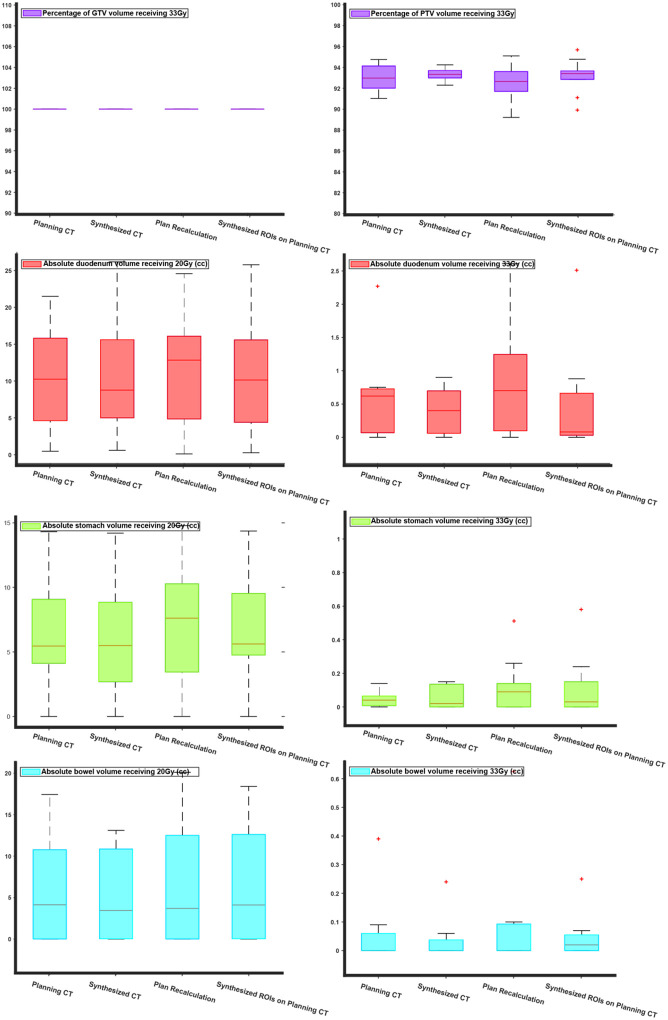
Figure 6.
Comparison of dosimetric indices for SBRT plans: the comparison was done for V33Gy for target volumes (GTV and PTV) and V33Gy and V20Gy for the proximal OARs (duodenum, stomach, and bowel). Each figure consists of four box plots for RT plans designed on pCT (ground truth), sCT, and plan recalculation (dose recalculation by shifting the isocenter of beams to pCT isocenter), Synthesized ROIs on planning CT (dose recalculation on pCT using sCT ROIs).

