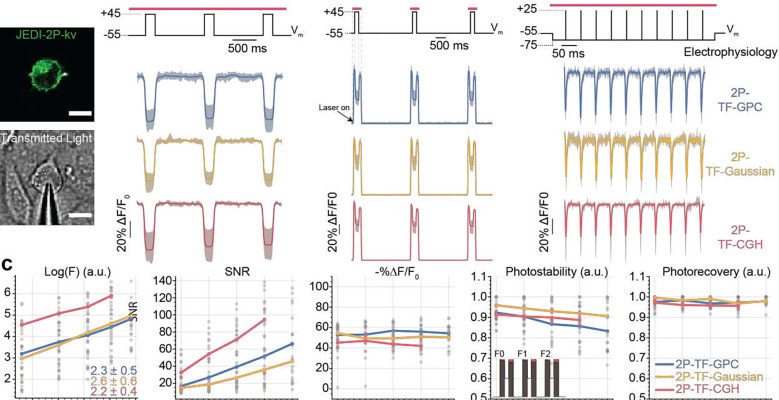
Figure 2. In-vitro electrophysiological characterisation of scanless two-photon voltage imaging in cultured CHO cells.
(a) Confocal image of a JEDI-2P-kv expressing CHO cell (upper) and transmitted light image of a patched CHO cell (lower). Scale bars represent 10 μm. (b) Data from three protocols used to test the performance of each of the three different parallel illumination modalities for two-photon voltage imaging. Responses are reported as the fluorescence change (ΔF) normalized by the baseline fluorescence (F0), expressed as a percentage of the baseline fluorescence (%ΔF/F0). The average trace and 95 percent confidence interval from all cells imaged with each modality are plotted (blue – GPC, yellow – Gaussian, red – CGH). The corresponding electrophysiology control signals are plotted in black. The red bar above the electrophysiology trace indicates the illumination epoch. (c) Quantification of data for all cells from protocol 2. Log(F), SNR, −%ΔF/F0, photobleaching and photorecovery are plotted as a function of power density (power density: 0.66 – 1.55 mW μm−2, 75 – 175 mW per cell, n = 8 – 13), see also Supplementary Figure 9. Each point represents a measurement from an individual cell. The mean is plotted for each condition. Photostability is defined as the ratio between the integral of the baseline fluorescent trace to F0*nt where F0 represents the fluorescence in the first frame and nt the number of baseline fluorescence timepoints (see schematic diagram, fourth panel, inset). Photorecovery is defined as the average ratio of the fluorescence prior to the 100-mV depolarization in each illumination epoch (for instance F1/F0 as defined in the schematic diagram, fourth panel, inset). All data was acquired with laser A tuned to 940 nm and camera A (See Supplementary Figure 1 and Supplementary Tables 1 and 2).

