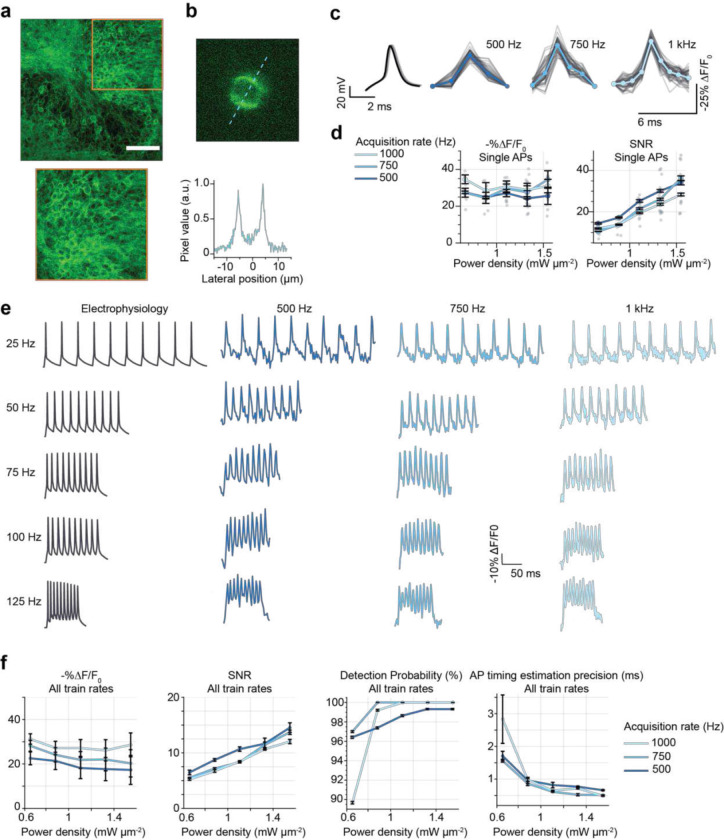
Figure 3. Recording electrically evoked single action potentials and high-frequency spike trains in JEDI-2P-kv expressing hippocampal organotypic slices with 2P-TF-GPC.
(a) Upper: confocal image of a representative organotypic slice bulk-infected with JEDI-2P-kv. Scale bar represents 75 μm. Lower: zoom (x2) of densely expressing region where data was recorded. (b) Upper: representative single frame from data acquired with TF-GPC (1 ms exposure time), Lower: line-profile through the image (indicated by the dashed line) demonstrating that single cells are imaged with high-contrast in densely labelled samples with 2P-TF-GPC. (c) Electrically induced and recorded action potentials (left) and optically recorded (right) were resolved in single trials using 2P-TF-GPC at different acquisition rates. Individual trials are plotted in grey. The average trace across all trials is plotted in a different shade of blue corresponding to each acquisition rate (500 Hz, 750 Hz and 1 kHz, as labelled). Power density: 1.1 mW μm−2 (125 mW per cell). (d) −%ΔF/F0 and SNR plotted as a function of power density in different shades of blue for different acquisition rates (see legend). Error bars represent the standard error of measurements across all cells (n = 4–6). Individual points represent the average value over 50 action potentials for individual cells. All data were acquired using laser A tuned at 940 nm, and camera A (See Supplementary Figure 1 and Supplementary Tables 1 and 2). (e) Representative fluorescence traces recorded from individual cells to different rates of electrically evoked spike trains recorded at the different acquisition rates of 500 Hz, 750 Hz and 1 kHz corresponding to 2 ms, 1,33 ms and 1 ms exposure time (power density: 1.1 mW μm−2, 125 mW per cell). A representative trace of electrically evoked spike trains is also plotted in black (left). (f) −%ΔF/F0, SNR, action potential detection probability and precision of action potential timing estimation (defined as the jitter in timing estimation for all identified action potentials relative to the corresponding electrophysiological recordings) plotted as a function of power density for different acquisition rates (500 Hz, 750 Hz, and 1 kHz, see legend). A lower value indicates superior timing estimation. Data plotted for all train rates (n = 2–5). All data were acquired using laser B fixed at 920 nm, and camera B (See Supplementary Figure 1 and Supplementary Tables 1 and 2

