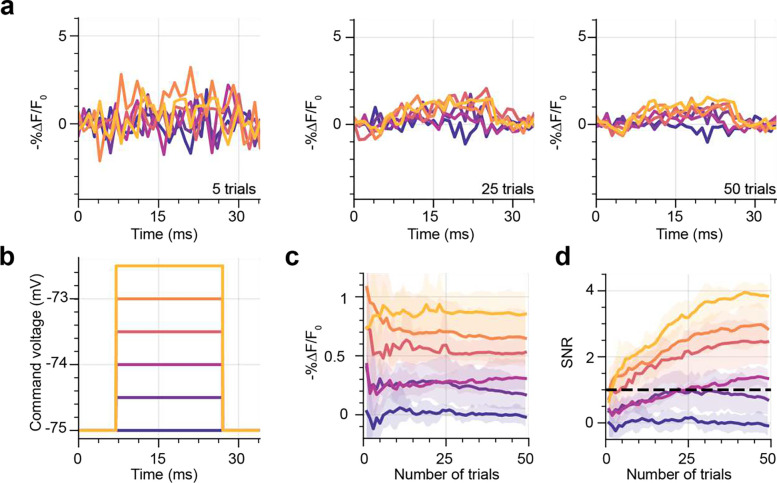
Figure 4. Recording sub-threshold depolarizations in JEDI-2P-kv expressing hippocampal organotypic slices using 2P-TF-GPC.
(a) Average fluorescence traces recorded from neurons after 5, 25 and 50 trials for different magnitudes of sub-threshold depolarizations ranging between 0 and 2.5 mV. Sub-threshold depolarisations < 2.5 mV cannot be reliably resolved in single trials using 2P-TF-GPC and JEDI-2P-kv, however after 25 trials depolarisations greater than or equal to 1 mV can be resolved. Traces were recorded with a 1 ms exposure time and 1.1 mW μm−2 (125 mW per cell). (b) Command voltage steps used to change the membrane potential of patched neurons. (c) Average −%ΔF/F0 and (d) SNR of the fluorescence response to different sub-threshold changes of membrane potential plotted as a function of number of repeats. The 95% confidence interval is also plotted (shaded region). All data (n = 6) were acquired using laser B fixed at 920 nm and camera B (See Supplementary Figure 1 and Supplementary Tables 1 and 2).

