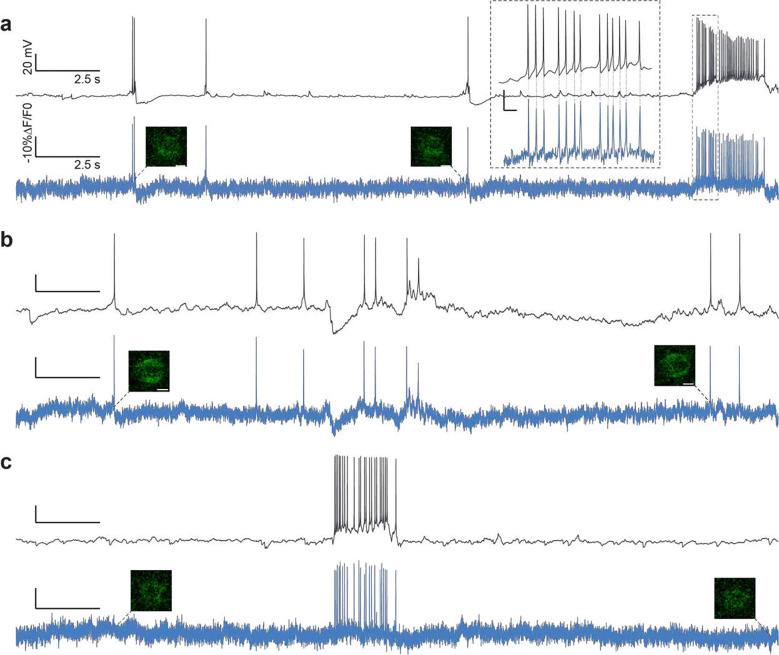
Figure 5. Recording spontaneous neural activity in JEDI-2P-kv expressing hippocampal organotypic slices using 2P-TF-GPC.
(a-c) Simultaneous current clamp (upper, black) and fluorescence recordings (lower, blue) of spontaneous activity in neurons from hippocampal organotypic slices over a continuous 30 s recording period. Single imaging frames are shown close to the beginning and end of each recording. Scale bars represent 5 μm. Inset, (a) zoomed in portion of the electrophysiological and fluorescence traces. Corresponding action potentials in the electrophysiological and fluorescence traces (average rate: 17 Hz) is indicated by the dashed lines. (Power density: 1.33 mW μm−2, 150 mW per cell, 1 kHz acquisition rate). All data was acquired using laser A tuned to 940 nm and camera A (See Supplementary Figure 1 and Supplementary Tables 1 and 2).

