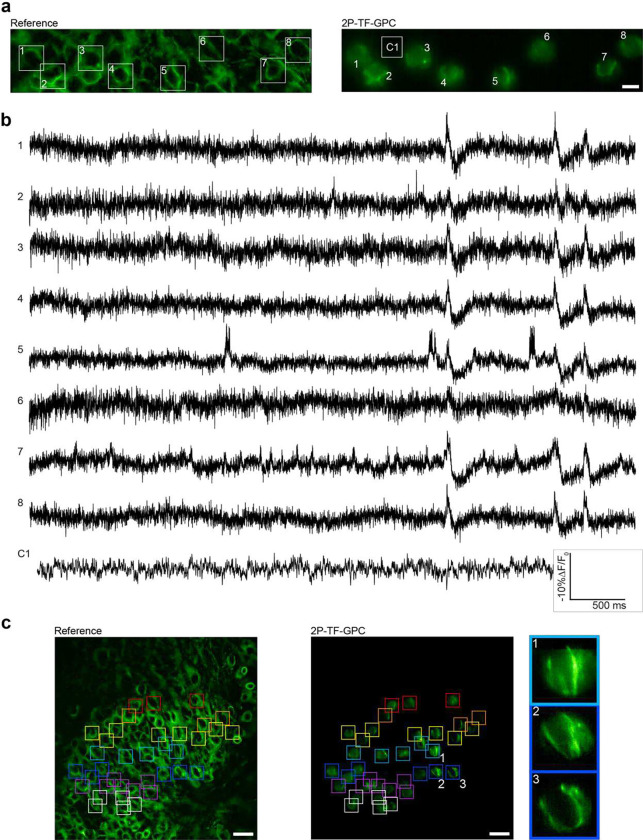
Figure 6. Multi-cell recordings of spontaneous neural activity in JEDI-2P-kv expressing hippocampal organotypic slices using multiplexed 2P-TF-GPC.
(a) Reference image of a hippocampal organotypic slice expressing JEDI-2P-kv in the dentate gyrus (left panel) and average projection of the corresponding voltage imaging dataset (right panel). 8 neurons targeted simultaneously with 8, 12-μm 2P-TF-GPC spots can be identified (as numbered and highlighted by the square boxes). The scale bar represents 10 μm. C1 refers to the area used to generate the control trace plotted in (b). This ROI was not targeted with a GPC spot during experiments. (b) Fluorescent traces plotted for each of the neurons indicated in (a), including the control trace. (c) Voltage imaging throughout a large field of view using multiplexed 2P-TF-GPC. Left panel: cross-section of a hippocampal organotypic slice expressing JEDI-2P-kv in the dentate gyrus. Middle panel: combined maximum projections of data from 7 consecutive acquisitions (indicated by the coloured squares), spanning a total area of 200 × 150 μm². Zoom in for best viewing. Scale bars represent 25 μm. Right panel: zoomed in regions of the central panel (indicated by numbering and coloured boxes) showing maximum projections of data acquired from individual cells targeted with multiplexed 2P-TF-GPC. All data was acquired using laser C (940 nm, power density: 0.02 – 0.09 mW μm−2, 2.5 – 10 mW per cell) and camera A with an acquisition rate of 1 kHz (See Supplementary Figure 1 and Supplementary Tables 1 and 2).

