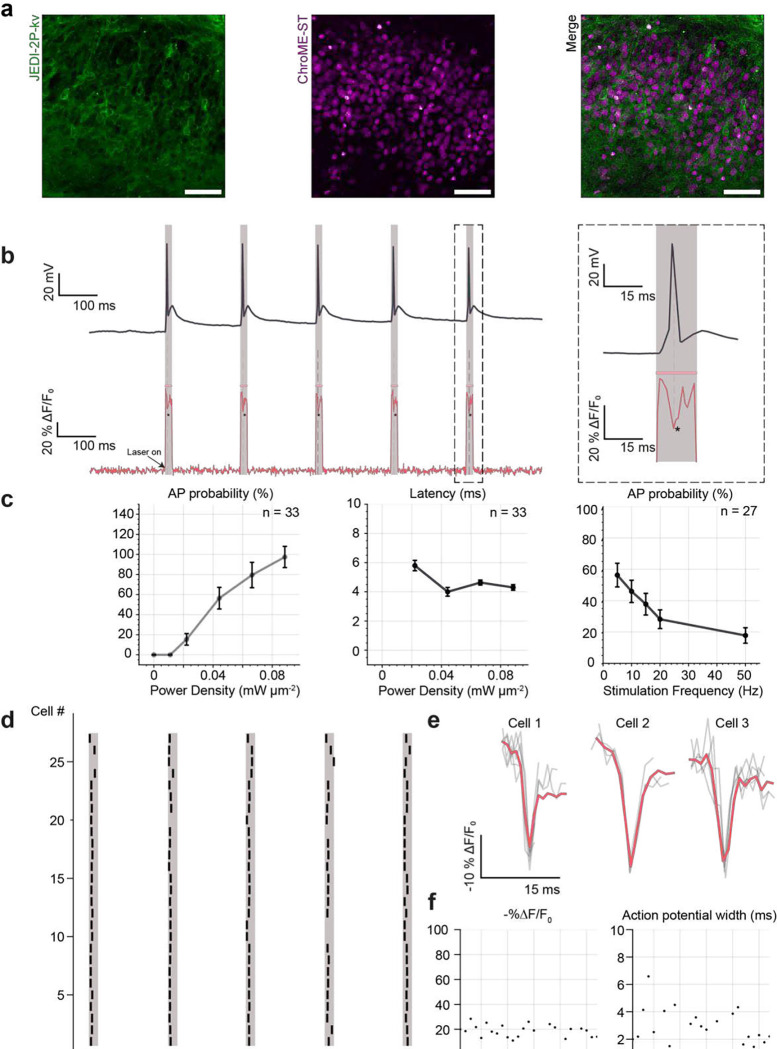
Figure 7. Fluorescence recordings of photo-evoked spikes in hippocampal organotypic slices co- expressing JEDI-2P-kv and ChroME-ST, using 2P-TF-CGH.
(a) Cross-sections of hippocampal organotypic slices co-expressing the genetically encoded voltage indicator JEDI-2P-kv and the soma-targeted channelrhodopsin ChroME-ST in the dentate gyrus. Channelrhodopsin-expressing cells were identified according to their nuclear-localized fluorescence (see Methods). Scale bar represents 50 μm. (b) (left) Simultaneous optical and electrophysiological recordings demonstrating that action potentials can be evoked and imaged using a single excitation spot (12 μm diameter, power density 0.02 mW μm−2 (2.5 mW per cell), 15 ms strobed illumination at 5 Hz). (right) Zoom on simultaneous optical and electrophysiological recordings of one action potential. (c) All-optical in-situ characterisation of photo evoked action potentials. Error bars represent the standard error of recordings obtained for 33 cells. The probability of evoking and recording action potentials is plotted as a function of power density. Only cells in which at least one optically evoked action potential was detected are included. The latency of optically evoked action potentials is plotted as a function of power density. The average latency measured all-optically matches that obtained using electrophysiology (Supplementary Figure 20c). The action potential probability is plotted as a function of stimulation frequency. Action potential probability is calculated as the number of action potentials evoked and recorded over five trials (power density: 0.01 – 0.09 mW μm−2, 1.5 – 10 mW per cell). Error bars represent the standard error of recordings obtained for 33 cells. (d) Raster plot of 27 cells showing the number and timing of optically evoked action potentials (black) relative to the imaging/photostimulation epoch (red) (power density: 0.02 – 0.08 mW μm−2, 2.5 – 9 mW per cell). (e) Examples of fluorescence recordings of optically evoked action potentials for three representative cells. Individual trials are plotted in grey. The average trace across all trials is plotted in red (power density: 0.02 – 0.08 mW μm−2, 2.5 – 9 mW per cell). (f) Summary statistics for the amplitude (−%ΔF/F0) and width of the optically evoked action potentials from (d). All data were acquired using laser C fixed at 940 nm and camera A (See Supplementary Figure 1 and Supplementary Tables 1 and 2).

