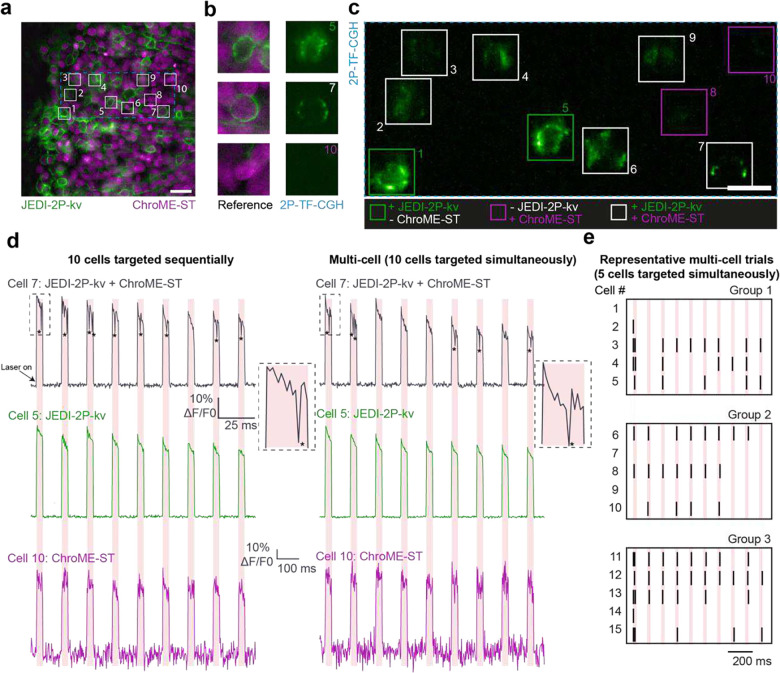
Figure 8. Characterisation of simultaneous multi-target photostimulation and voltage imaging using a single beam scanless two-photon excitation.
(a) Cross-sections of hippocampal organotypic slices co-expressing JEDI-2P-kv and ChroME-ST in the dentate gyrus. The boxes indicate cells that were targeted simultaneously during a representative experiment (as numbered). Scale bar represents 25 μm. (b) Reference widefield images of individual targeted cells (left) and corresponding images obtained using 2P-TF-CGH. Upper: a cell exclusively expressing JEDI-2P-kv. Middle: a cell co-expressing JEDI-2P-kv and ChroME-ST. Lower: a cell exclusively expressing ChroME-ST. (c) Data acquired when the 10 cells identified in (a) were targeted simultaneously using 2P-TF-CGH and imaged at 500 Hz. Scale bar represents 15 μm. (d) Traces from the three cells highlighted in (b) when targeted sequentially (left) or simultaneously (right). Of the three selected cells, as expected, no action potentials were detected for cell 5 (green) or cell 10 (purple), which did not co-express the two constructs. In both the sequential and multi-cell acquisitions, action potentials were only evoked/ recorded in the cells co-expressing JEDI-2P-kv and ChroME-ST (black). (e) Raster plots from 3 further experiments in which 5 cells were targeted simultaneously. Black lines indicate the time at which a cell fired; the red lines indicate the imaging/photostimulation laser. All data were acquired using laser C fixed at 940 nm and camera A (See Supplementary Figure 1 and Supplementary Tables 1 and 2).

