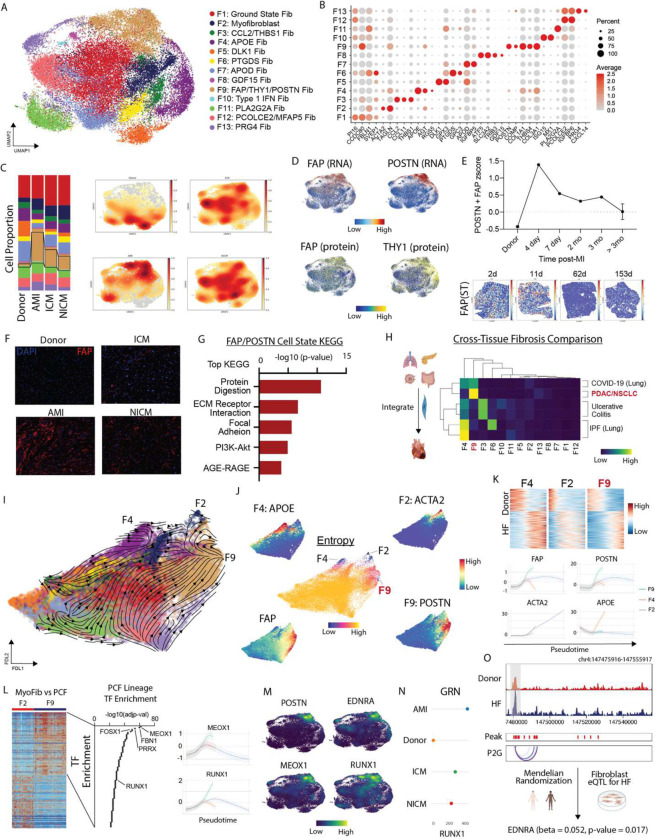
Figure 2.
FAP fibroblasts expand post-MI into a PF lineage with a MEOX1/RUNX1 orchestrated gene regulation network. (A) UMAP embedding of CITE-seq fibroblast cell states. (B) Dot Plot of marker genes for fibroblast cell states. (C) Fibroblast cell state composition across four groups (left) and Gaussian kernel density estimation of cells across four groups (right). (D) FAP RNA (top left), POSTN RNA (top right), FAP protein (bottom left), and THY1 protein (bottom right). (E) FAP/POSTN z-score in donor, acute MI, and ICM split by time from MI with spatial transcriptomics samples showing FAP expression at different time points post-MI in human LV specimens. (F) Immunofluorescence of FAP in donor, acute MI (4 days post-MI), ICM, and NICM left ventricle myocardium. (G) Top KEGG pathways for FAP/POSTN cell state. (H) Cross-tissue fibrosis Pearson correlation coefficient between human heart fibroblast cell states and those from other disease contexts. (I) scvelo analysis in force directed layout embedding and (J) Palantir derived entropy with terminal cell states noted and marker genes for terminal states in addition to FAP plotted in FDL embedding highlighting FAP derived fibroblasts diverge into myofibroblats and PFs. (K) Heatmap of pseudobulk differentially expressed genes between donor and HF and terminal state marker genes over pseudotime. (L) Heatmap of differentially expressed genes between F2 and F9 fibroblast cell states (left), TF enrichment analysis for F9 lineage using enrichR (TF-Gene Co-occurrence database) shows key epigenetic regulators of the F9 lineage (middle), and RUNX1/MEOX1 gene expression across pseudotime for 3 lineages showing increased expression along F9 lineage (right). (M) Gene expression density plot in UMAP embedding for POSTN, RUNX1, EDNRA, and MEOX1 (markers distinguishing F2 and F9 lineages). (N) CellOracle gene regulatory network betweenness centrality score for RUNX1 by HF etiology – a higher score indicates that the TF has a greater influence on informational flow in the GRN. (O) ATAC-seq pseudobulk tracts from multiome fibroblasts with peak2gene linkages showing EDNRA locus split by donor and HF; Mendelian Randomization shows that there was a significant positive association between genetically predicted EDNRA gene expression levels and HF in fibroblasts (beta = 0.052, se = 0.022, and p-value = 0.017).

