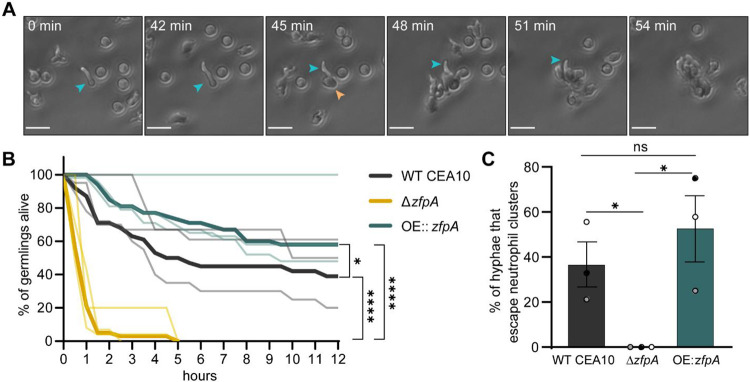
Fig 3. ZfpA promotes resistance to neutrophil killing.
Outcomes of human neutrophil interactions with WT CEA10, ΔzfpA, and OE::zfpA following 12 h of co-incubation. Neutrophils were added to A. fumigatus germlings (neutrophil:spore 100:1) in 24-well plates and images were acquired every 3 min for 12 h. (A) Representative images of neutrophils detecting and tightly clustering around an A. fumigatus (OE::zfpA) germling within the first hour of co-incubation. Blue arrow indicates visible germling. Orange arrow indicates first neutrophil contact. Scale bar = 20 μm. (B) Percent of germlings alive determined by presence of cytoplasmic RFP signal at 30 min intervals over 12 h. Thin lines represent data from 3 independent experiments, thick lines represent pooled data. n = 38-47 germlings per strain. p values calculated by Cox proportional hazard regression analysis. (C) Percent of germlings able to “escape” neutrophil contact by extending hyphae outside of surrounding neutrophil clusters. Bars represent mean ±s.e.m. Dots represent independent experiments. p values calculated by t-tests. *p<0.05, ****p<0.0001.

